Present your findings with a range of quantitative and/or qualitative techniques. Each technique should be accurately drawn and appropriate for the information being presented. Here are some suggestions.
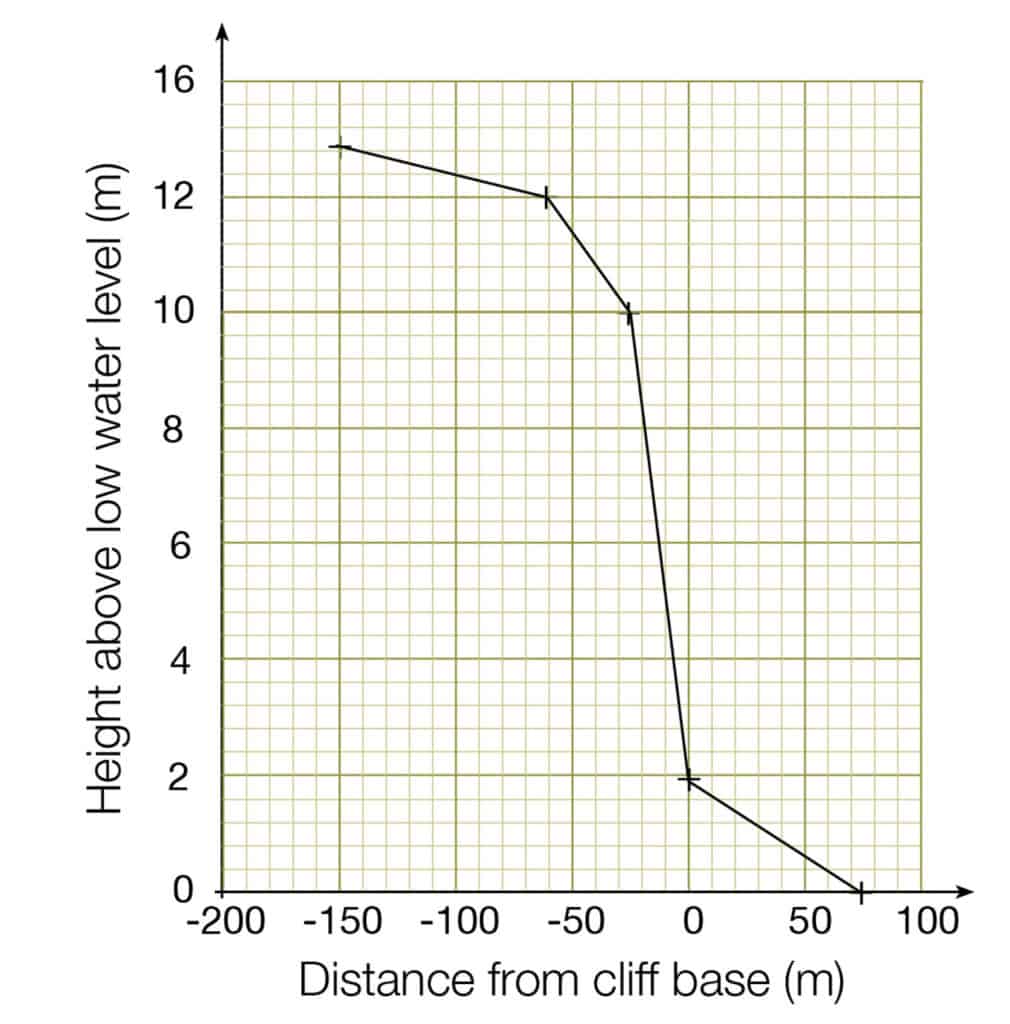
Cliff profiles
A cliff profile is a cross section of the cliff from mean low water mark to the top of the cliff. The y-axis is often exaggerated on a beach profile.
The distance and angle information for each facet of the cliff can be plotted by hand. See image below for an example of a low cliff on the Suffolk coast. Alternatively, complete cliff profiles can be presented around a map.
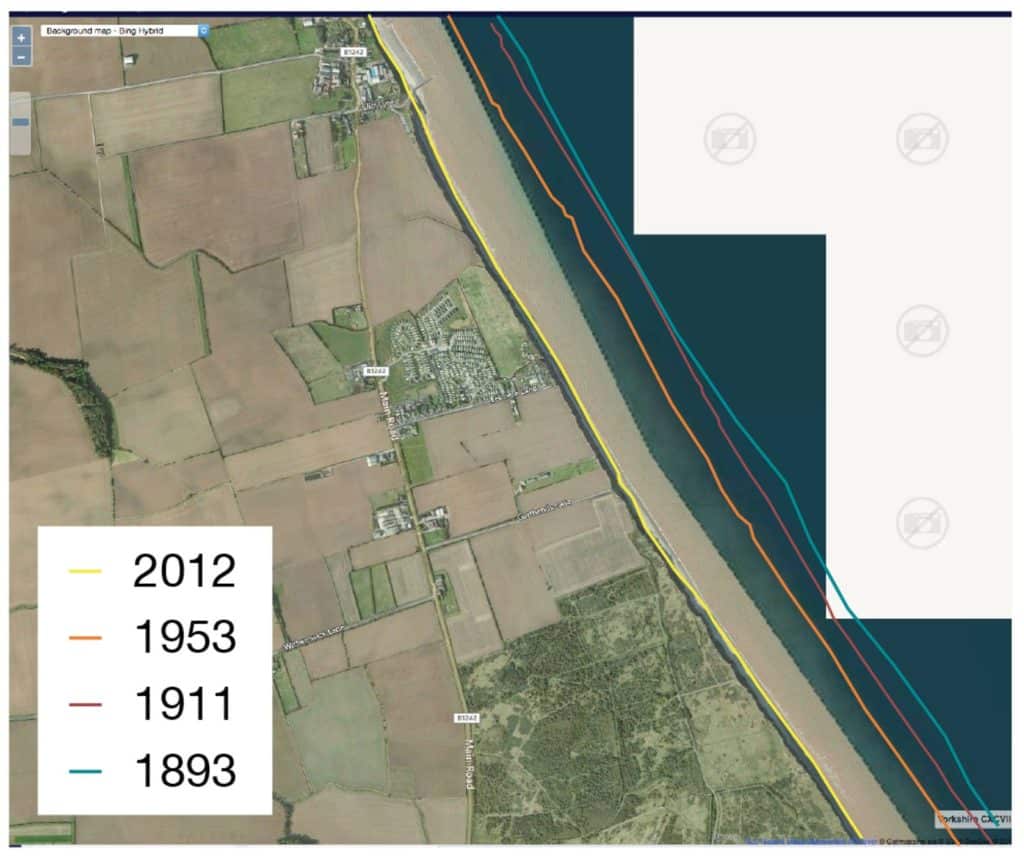
Cliff retreat maps
Using overlaid maps (from the National Library of Scotland website or ArcGIS), it is possible to trace the position of the coastline at different times. Use the mean high water level for each map. The example below shows cliff retreat for a short stretch of the coast of East Yorkshire.
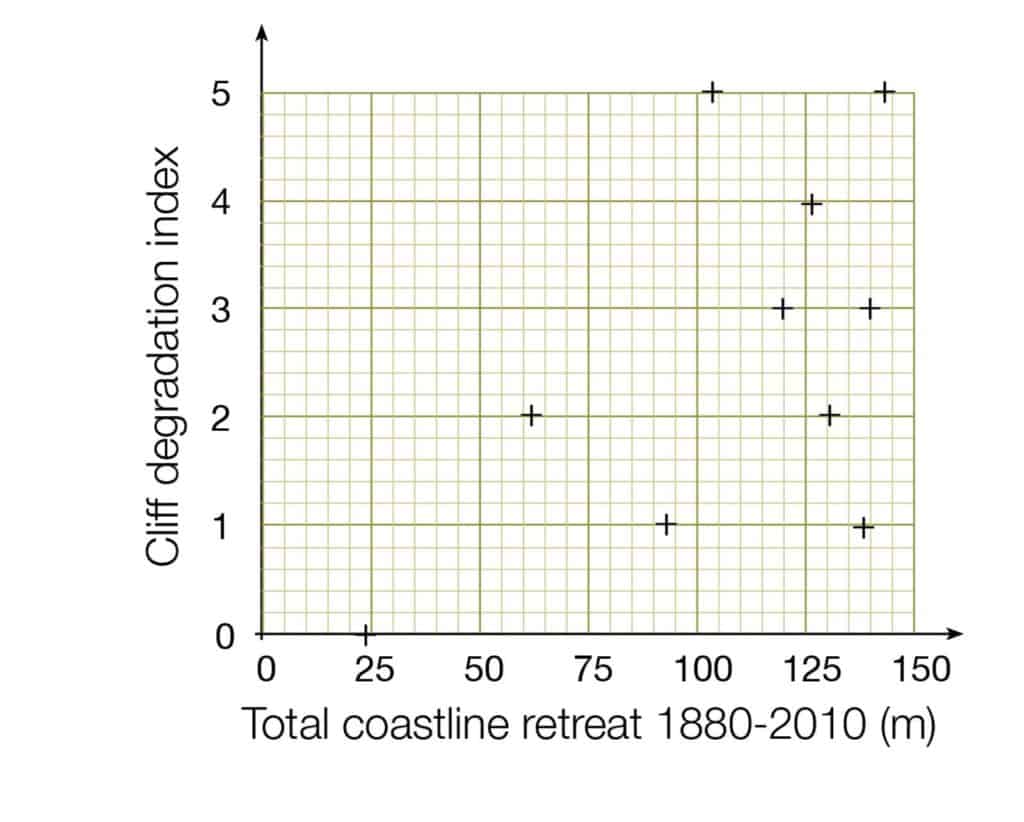
Scattergraphs
Combine data you have collected in the field with secondary data.

Secondary and Further Education Courses
Set your students up for success with our secondary school trips and courses. Offering excellent first hand experiences for your students, all linked to the curriculum.
Group Leader and Teacher Training
Centre-based and digital courses for teachers