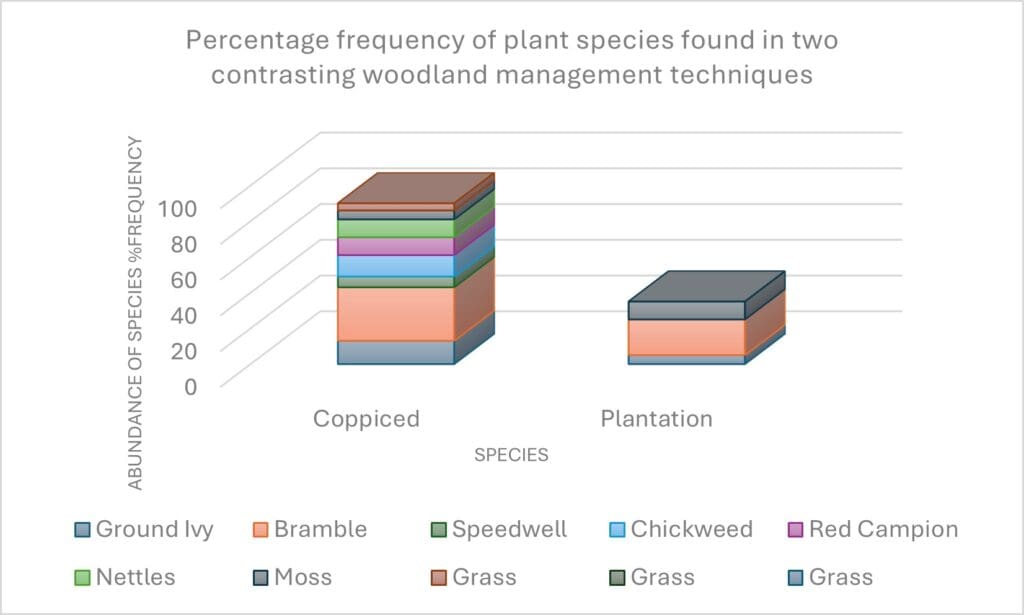
There are numerous ways to present data from the various data collection techniques, deciding whether your data is a correlation (measured along a transect) or a direct comparison (discrete data points) can help decide what kind of graph is suitable.

In an investigation to show the impact of trampling on plants, infiltration rates may have been measured to show the level of trampling and can be plotted against species richness in a scatter graph.
An investigation into two areas, such as a comparison between woodland management techniques, might better suit a bar graph or a divided bar graph. The benefit of the divided bar being that you can see both the total abundance and the relative abundance of each species, or the evenness of the plant community.