
Quantitative methods
Sampling
For the collection of your quantitative data, it is important to make sure your sampling area is representative of the larger ecosystem, considering how big the managed section of a woodland is for example in comparison to the non-managed, and what sample size would be valid in that area.
The accessibility of your chosen site is important to consider as safety and accessibility, especially in woodland environments, will affect where you can take samples from. In a woodland ecosystem, contrasting areas may be sampled with a random sample grid with multiple quadrats at random coordinates. However, if considering the impact of decreasing canopy cover or trampling on the vegetation, a systematic sample maybe more appropriate along an environmental gradient.
Biotic Measurements
Plant abundance / richness / diversity in a random sample
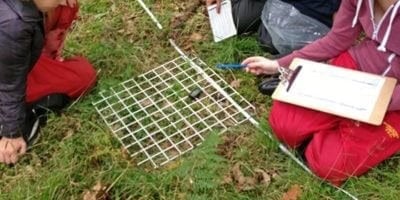
The instructions for using quadrats with classes are notoriously variable. Throwing a quadrat is not truly random – pupils may aim for conspicuous patches of plants, and they are unlikely to sample ground close to their feet and areas immediately behind trees. You may also be conscious of the dangers of pupils throwing quadrats at each other. A useful strategy that we have used is outlined below:
- Use a calculator or random number generator app to assign each group random numbers as coordinates.
- Lay two 10m measuring tapes perpendicular to each other in the study area, with the start of each (0,0) as the origin.
- If a group has the coordinates 1,4 and 9,6, one individual should walk along the tape until reaching the distance for each coordinate, e.g. one stopping at 1.4m and another at 9.6m
- Then they turn into the plot at a right angle to the tape and walk into the plot until they meet. They should place the quadrat here.
The students can then identify the plants and count the number of individuals in each species present in the quadrat. This is species richness. These values can be used to calculate species diversity for challenge. For support see this helpful guide from the RGS on calculation of species diversity: https://www.rgs.org/media/epqgou23/gaguidetosimpsonsdiversityindex.pdf. Alternatively, species abundance can be measured in Percentage (%) cover of different plant species. A gridded quadrat is helpful here.
Plant abundance / richness / diversity along a transect
Similarly plant abundance in percentage cover or species richness / diversity can be measured along a transect. If looking at the impact of trampling on plant communities, a transect could be taken from the edge of a worn path or track out away from the main footfall. Frame or point frame quadrats (best for taller vegetation) could be used to record the species present or the point frequency respectively. Consideration should be given to the intervals across the transect, aiming for 10+ quadrats spaced along the area of sample.
Identifying plants
The fold-out guide Playing Field Plants can be used to help with identification. We have found that it is sometimes useful with classes to spend a few minutes creating a ‘species board’. Choose the five most common grassland plants (not grasses) growing at the time of sampling and ask each group of pupils to attach, with sticky tape, a labelled sample of each plant (including flowers and leaves) to a wooden board. They can use this board for reference while collecting data from quadrats.
Canopy cover can be measured simply by holding a quadrat up above you and assessing the percentage cover of tree canopy that is shading the view of the sky through the quadrat.
Abiotic measurements:
Climate, soil and water
Measurements of light intensity (lux), temperature (°c) and relative humidity (%) can be measured with handheld devices or data loggers. Consideration should be given to repeated measurements, average values and representative samples.
Soil depth or compaction can be measured simply with a soil pin or knitting needle with an elastic band tied around it, placed at the bottom: one student (keeping it the same reduces the error of individual strength) pushes the needle into the ground until resistance is met. On removal, a ruler can be used to measure the depth (up to the band) that penetrated the soil (mm), i.e. where the band has been pushed up to. Soil pH can be measured with either handheld devices or a simple litmus test if a soil sample can be taken and dissolved in deionised water.
Soil moisture can be measured by taking soil samples back to a lab. Soil weight is measured then the soil is “dried”, in a microwave or soil oven, until a control water sample has evaporated. The soil is then reweighed. The percentage change in moisture can be calculated.

Soil infiltration rates could be measured. This can tell us about the permeability of the substrate and the relative saturation of the ground.
You will need
- container of water (keep this constant between experiments – 4 litres is enough)
- 30 cm ruler
- metal / plastic tube (to be the ‘infiltration tube’)
- stopwatch
- block of wood and mallet
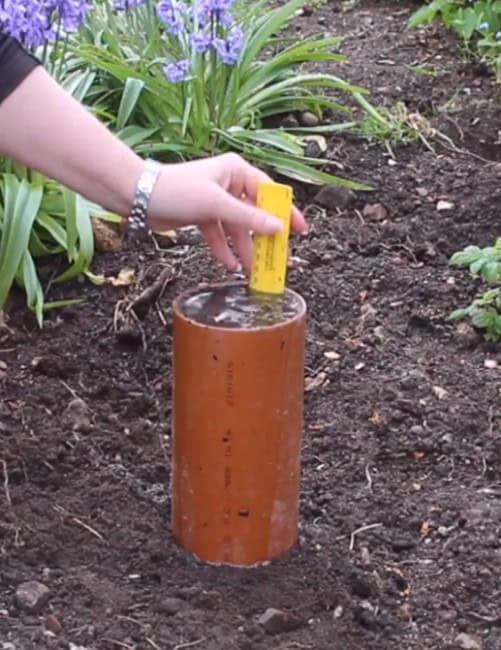
Bang the infiltration tube into the ground until it forms a seal (using the wood and mallet to bang it in evenly and avoid affecting the results by stamping on the area of land being tested).
One person fills the infiltration tube to the top is they are the same height, or a standardised level (e.g. 15cm). The other starts the stopwatch and then records the water level every 30 seconds for 2 minutes total. Create a table showing the water level drop every 30 seconds over the 2minute period.
Calculate the mean drop in mm / minute to show the infiltration rate.
Qualitative methods
Field sketches and annotated photographs can be used to collect opinion based and non-quantifiable data, such as seasonal changes, where people walk and why, the types of trees and how management is impacting the ecosystem.