Quantitative methods
Sampling
For the collection of your qualitative data it is not necessary (or practical!) to measure all parts of the river – you will need to take a sample.
The accessibility of your chosen site will have an influence on your approach to sampling – for a question investigating downstream changes it is ideal to gather data from points progressively further downstream.
A systematic sampling strategy as illustrated – with sampling sites at equal intervals downstream – will help remove bias in site selection, whilst ensuring that your data best illustrates any changes downstream.
In situations where access is more limited you may have to take a more opportunistic approach to sampling – however in this case it is sensible to get as close as possible to a systematic sample as possible.
An alternative approach would be to base your sampling on areas where you might expect significant changes in river discharge – By choosing sampling sites immediately downstream of confluences you may be able to identify the significant changes in discharge and consider the impact of stream order. This stratified sampling strategy is probably better suited to more able students who can justify their choice of sites.
Field measurements
Which river channel characteristics you chose to measure will depend on the question you investigate.
For the question “How and why does discharge change downstream at Glenderaterra Beck?” you will need to measure those variables required for the calculation of Discharge – Width, Depth and Velocity, but also may choose other variables that may help explain reasons for those changes.
In justifying your choice of the variables you have measured it can be helpful to consider the linkages between the different river variables.
Measuring river discharge
It is not possible to measure river discharge directly in the field. Instead take measurements which will allow us to calculate discharge.
\(\mathsf{Discharge \;(m^3\;per\;second) = Cross \;sectional\; area\; (m^2) \;\times\; Velocity\; (m/s)}\)
\(\mathsf{Cross\; sectional\; area\; (m^2) = Width\; (m) \times Mean\; depth\; (m)}\)
So in order to calculate Discharge we must measure Width, Depth and Velocity.
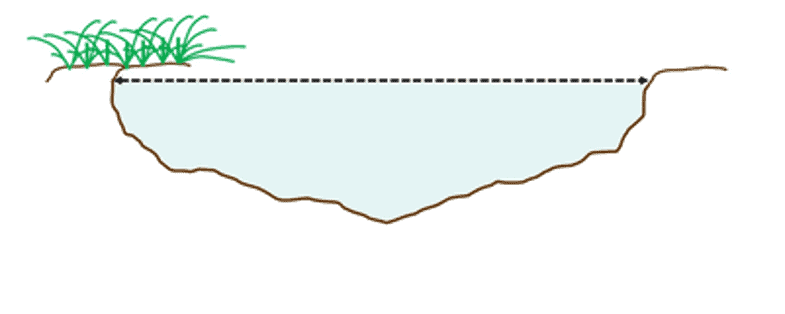
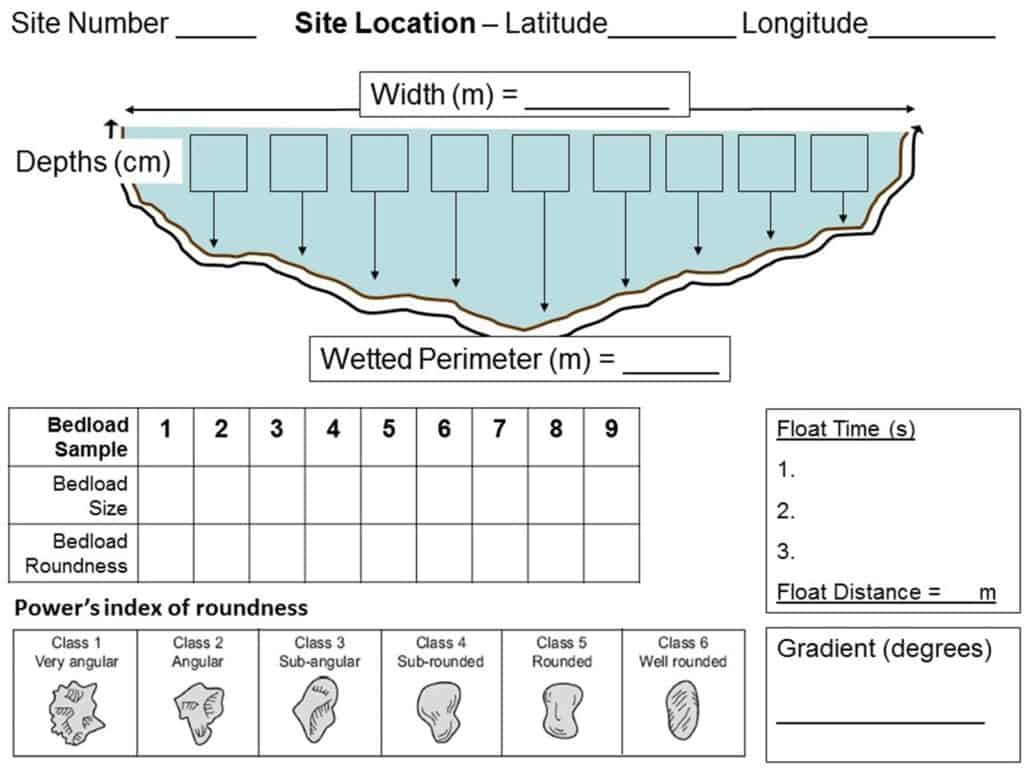
Measuring channel width
Using a tape measure, hold one end at the point where the water meets the bank one side of the channel. Ensure the tape is not twisted pull the tape measure across the river and measure to the point where the water meets the bank directly opposite.
To ensure accuracy:
- Ensure the tape is pulled taut
- Measure to the point directly opposite
- Ensure you are measuring across the surface of the water
- Be aware of any overhanging vegetation or undercut areas of bank
Measuring channel depth
There will probably be some variation in channel depth across the cross profile, so it would not be representative to take a single measurement of depth.
Instead take a number of measurements. How many measurements you chose to take will depend on the variability of the channel depth and the width of the river channel.
Divide width measurement by 10.
e.g. \(\mathsf{Width = 1.20 m}\)
so \( \mathsf{ \frac {width} {10} = 0.12m\; or\; 12cm} \)
Use this interval to measure at 9 equally spaced points across the channel.
With a metre rule measure from the water surface to the river bed.
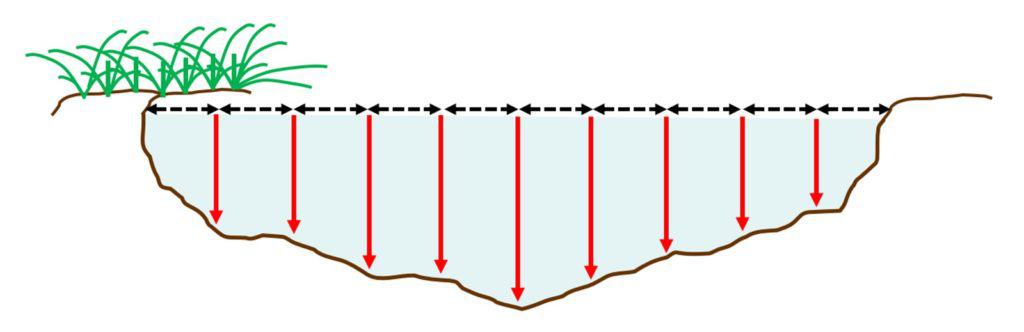
To ensure accuracy, turn the metre rule so that the narrow side of the ruler faces into the flow of the river.
Measuring velocity
With a flow meter it is possible to obtain a measure of velocity in the field – if you do not have access to a flow meter you can take some measurements using a float and calculate velocity using the formula
\(\mathsf{Velocity = \frac{Distance}{Time}}\)
Dog biscuits make good floats as they are not too easily moved by wind and break down in the water if swept away.
- Measure out 5 metres downstream
- Place the float in the water at the upstream end
- Start timing when you let go of the float
- When it reaches the end of your measured stretch stop timing
- Repeat three times and calculate a mean time
\(\mathsf{Velocity = \frac{5m}{Time}}\)
Recording site location
The easiest way to accurately record the locations of your sampling sites is to use a GPS – there are many different Smartphone apps that will allow you to do this. If you want to use GIS to locate your sites on a map or to display your data, you need to record your location as latitude and longitude.
Qualitative methods
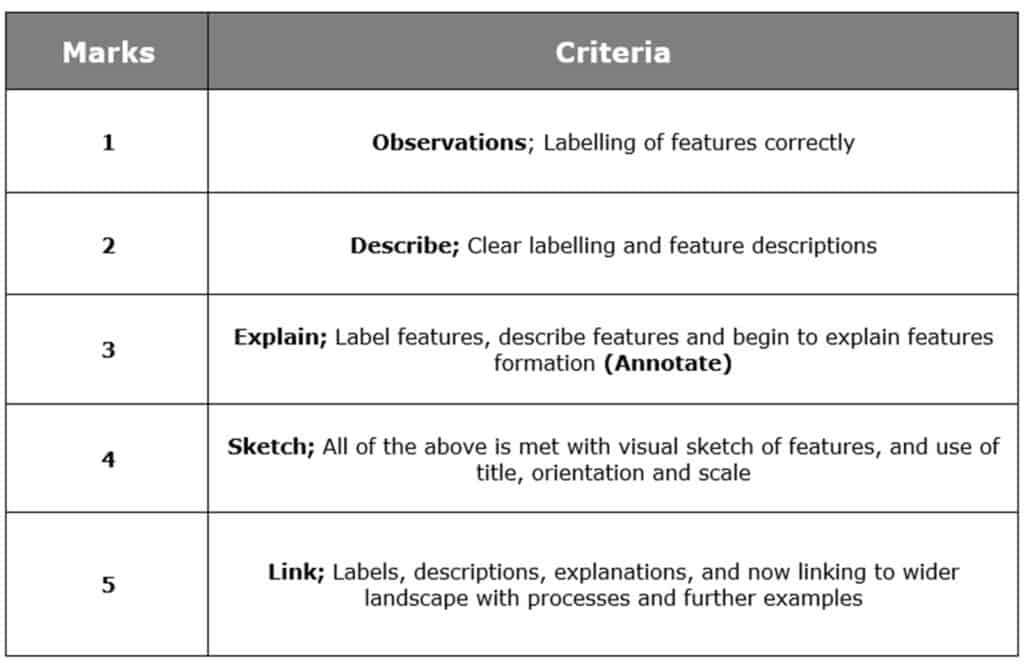
River landforms can be recorded using annotated field sketches or annotated photographs. These can be used to look at a view of the whole landscape from a given point, or in detail at given features. Here are some useful words to use.

Secondary and Further Education Courses
Set your students up for success with our secondary school trips and courses. Offering excellent first hand experiences for your students, all linked to the curriculum.
Group Leader and Teacher Training
Centre-based and digital courses for teachers