Present your findings with a range of quantitative and/or qualitative techniques. Each technique should be accurately drawn and appropriate for the information being presented. Here are some suggestions.
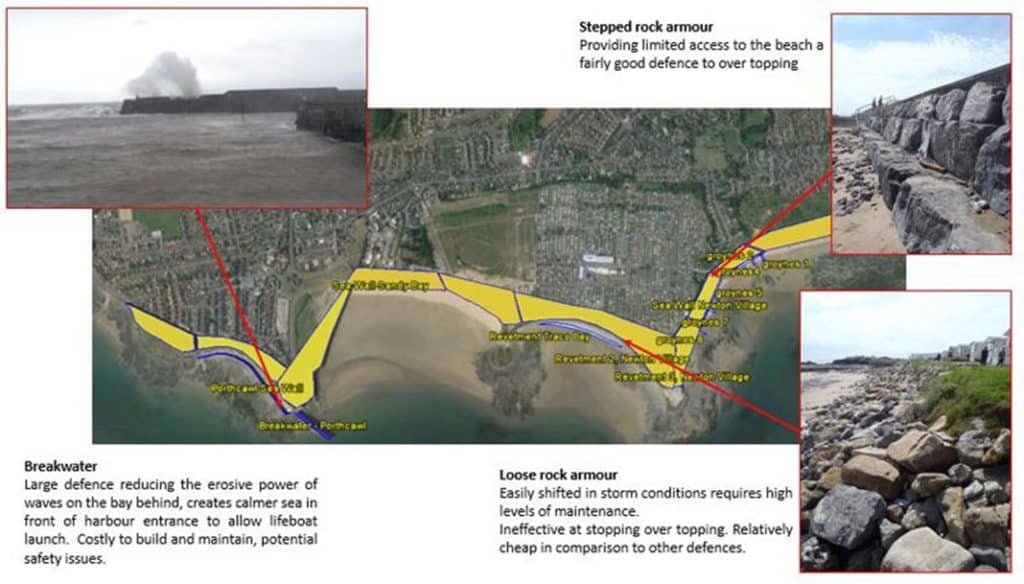
Effectiveness of coastal defences
Photographs taken and annotated on mobile devices (iPads/tablets/smart phones) can often be geo-located, either using apps such as GPS Log or by uploading them directly to Google Earth. Annotations can be put into geographical context as geo-located pictures alongside bi-polar evaluation scores.
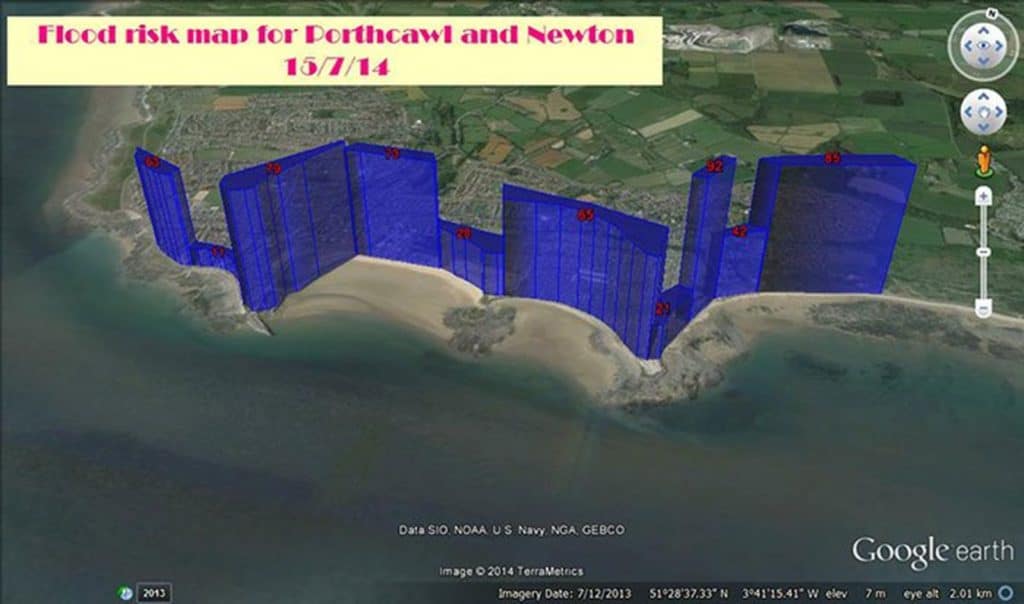
Flood risk and cost benefit analysis
Flood risk is a calculation based on your data collection of flood likelihood and severity. Both scores for likelihood and severity can be presented individually. All data is best represented as geo-located bar graphs as this allows some interpretation based on location. Use Google Earth to draw the different zones that you studied and save as a .kml file. By using GEGraph you can then assign values to each of the zones and present your work as a choropleth (by colour scale) or by height (bar graph).
Cost benefit analysis assessment scores can be equally well presented as a locational bar graph.
Beach profile comparison
A beach profile is a cross section of the beach from the top of the beach to the seashore. It shows distance on the x-axis and height above the seashore on the y-axis. Draw beach profiles for each site that you measured. Use the same scale on the x-axis and y-axis of each graph.
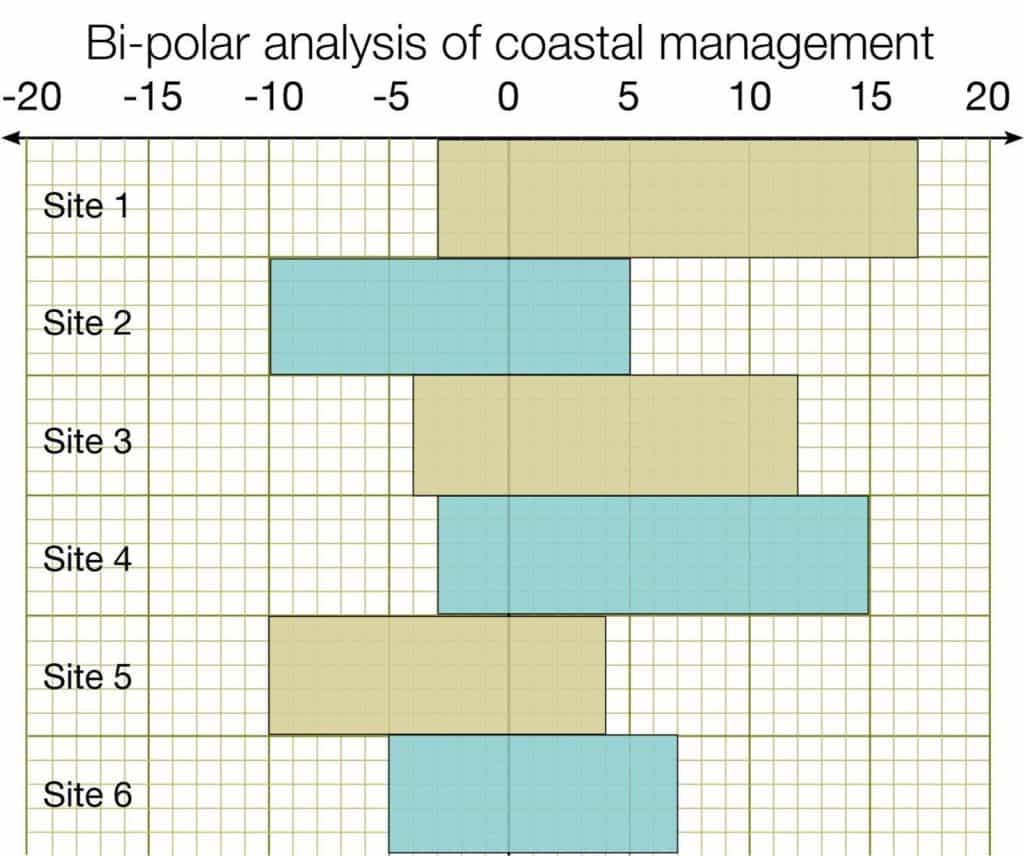
Bi-polar evaluation of defences
One way of displaying the results of the bipolar analysis is to construct a modified bar chart with the bi-polar score on the x-axis and the name of each location investigated on the y-axis.
Depending on the number of categories that you have chosen to use within each bi-polar assessment (aesthetics, effectiveness etc) a radar diagram can be plotted of the mean scores for each category allowing direct comparison between each coastal defence and analysis of the overall score.

Secondary and Further Education Courses
Set your students up for success with our secondary school trips and courses. Offering excellent first hand experiences for your students, all linked to the curriculum.
Group Leader and Teacher Training
Centre-based and digital courses for teachers