All Geography starts with someone going into the field to find out what’s there. This section will help you to gather the primary data (data you collect yourself) and secondary data (data collected by someone else) that will support your analysis and conclusions.
| Type of data | Primary data collection technique | Secondary data collection source |
|---|---|---|
| Beach morphology | Beach profiles Coarse sediment analysis: size and shape Fine sediment analysis: size and shape Longshore drift: direction and strength | Maps and aerial photographs Historical maps and photographs Wind and wave data |
| Physical impact of coastal management | Groyne measurements Rip-rap volume and weight measurements | Maps and aerial photographs Shoreline Management Plans |
| Human impact of coastal management | Bi-polar analysis Questionnaires Cost-benefit analysis | Shoreline Management Plans |
| Risk and vulnerability | Risk mapping | Historical sources |
Beach morphology
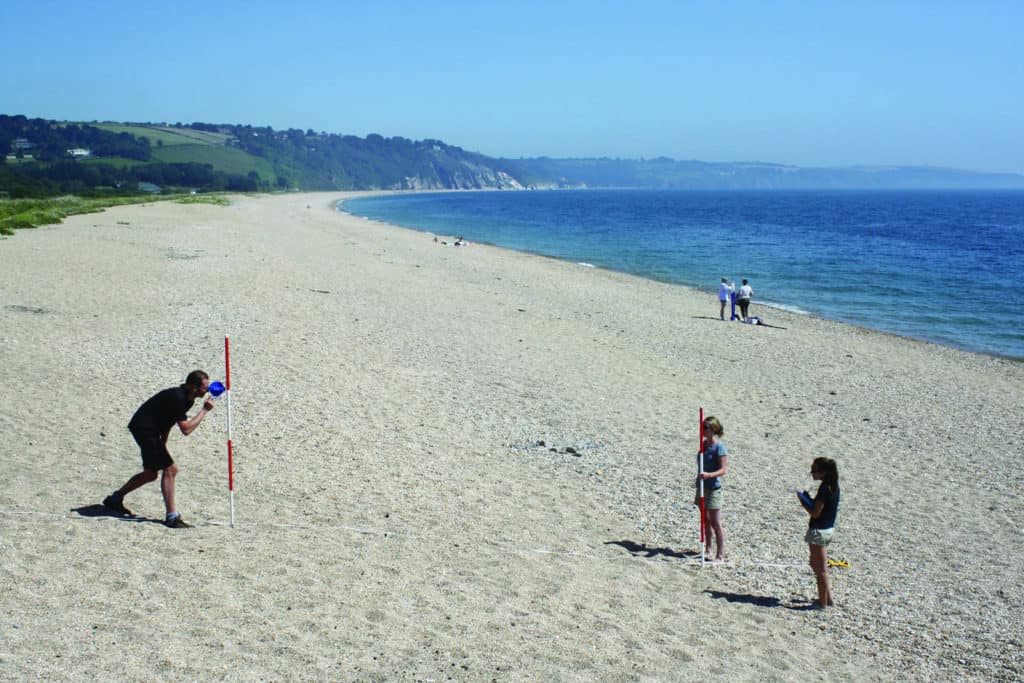
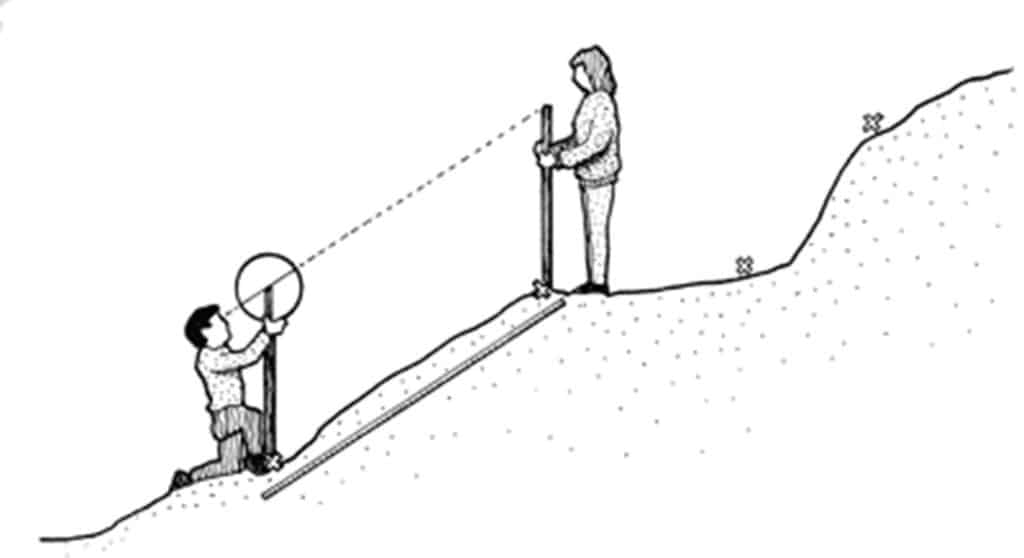
1. Beach profiles
Beach profiles use distance and angle measurements to help you investigate the shape of the beach.
Follow a straight transect line from the edge of the sea to the end of the active beach. Split the line into segments where the slope angle changes. Each reading is taken from from break of slope to break of slope.
- Person A stands at a safe distance from the edge of the sea holding a ranging pole
- Person B stands holding a second ranging pole further up the beach where there is a break of slope
- The distance between the two ranging poles is measured using a tape measure
- The angle between matching markers on each ranging pole is measured using a clinometer
- Repeat this process at each break of slope until the top of the beach is reached
Beach profiles can also be used to calculate cross-sectional area and the amount of beach material present.
2. Coarse sediment analysis
Random, systematic and/or stratified sampling is used to take a sample of beach sediments (such as sand, gravel and pebbles). The measurement technique used depends on the size of the sediments.
Measuring size
The size and shape of coarse sediments can be measured on the beach. You do not have to take any sediments from the beach to the lab.

Use rules or calipers to measure the a, b and c axes of each pebble.

- The a-axis is the longest axis
- The b-axis is the widest axis at right angles to the a-axis.
- The c-axis is the shortest axis
Measuring shape
The simplest way to record pebble shape is to classify the stone as very angular, angular, sub-angular, sub-rounded, rounded or very rounded using a Power’s Scale of Roundness. This is judged by eye.
Using a protractor or concentric circle card, measure the minimum radius of curvature. This is the sharpest corner on the a-axis.

Alternatively use the pebble size measurements (a, b and c axes) to calculate Zingg’s shape classification, Krumbein’s Index of Sphericity or Cailleux’s Flatness Index (see Data Analysis). Use the a-axis and minimum radius of curavture to calculate Cailleux’s Roundness Index.
3. Fine sediment analysis
Samples of fine sediments (clay,silt and sand) will need to be taken from the beach to the lab. Each sample should be placed in a sealed plastic bag and accurately labelled.
Use a set of graduated sieves can be used to sort sediment samples into different size categories (in millimetres or as phi sizes).
The sieves are arranged in decreasing mesh diameter with the largest at the top. The sediment sample is placed in the top sieve then the sieves are shaken to sort the sediment into the various sieves. The mass of sediment in each sieve is measured using scales and the percentage of the total sample can be calculated.
4. Longshore drift: direction and strength
Select 30-50 pebbles of different shapes and sizes from the beach. Use waterproof paint to mark each pebble. Spread the pebbles out in the swash zone, and place a marker further up the beach to show the start point for the pebbles. After 20 minutes find as many pebbles as you can, and measure how far each has moved from the start point.
After 20 minutes, you may find that some of the pebbles will have disappeared from the beach or moved in a different direction to the others. This does not mean that your results are ‘wrong’. Record what happened to each pebble (including ‘disappeared’).
Repeat the experiment at least 3 times, or until you judge that the running mean for distance travelled by a pebble indicates that you have taken an adequate sample.
Physical impact of coastal management
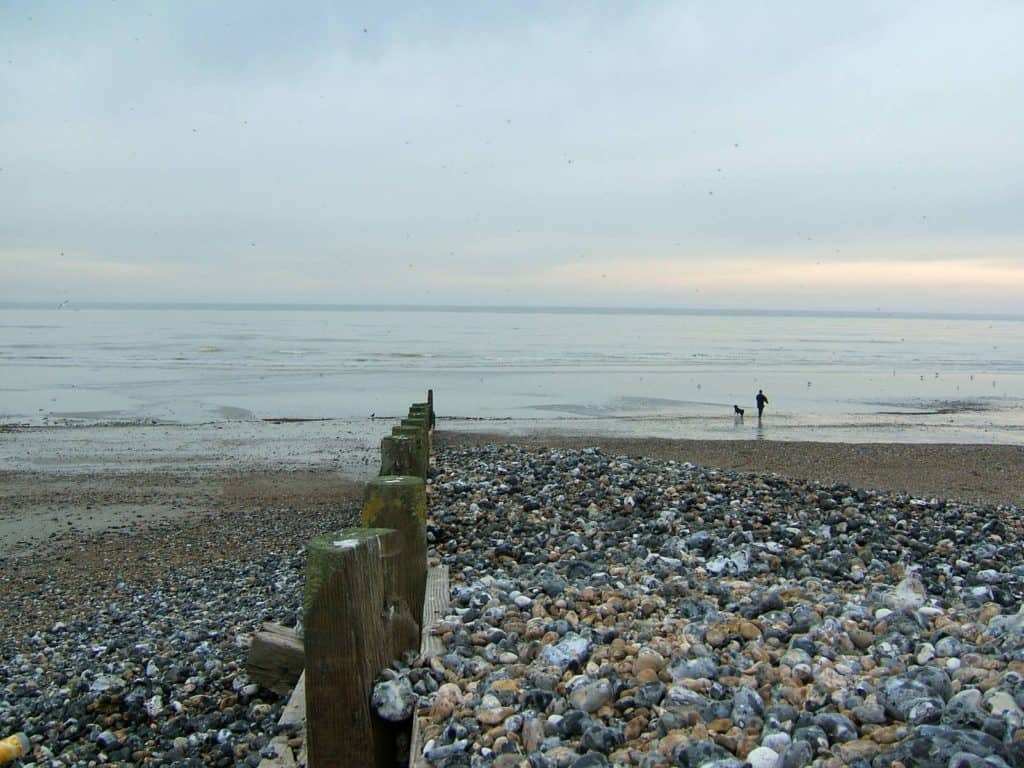
5. Groyne measurements
Use a tape measure to find the height of beach material on either side of a groyne. Measure in at least three heights along the beach profile for each groyne. You can compare a series of groynes along a length of beach.
6. Rip-rap volume and weight measurements
Rip-rap or rock armour is often used as a technique of coastal defence. You can collect field data on the effectiveness of the rip-rap simply by measuring the length, width and height of each boulder. Measure the angle of rest of the boulder – is the widest facing facing straight into the waves, or does it lie at an angle?
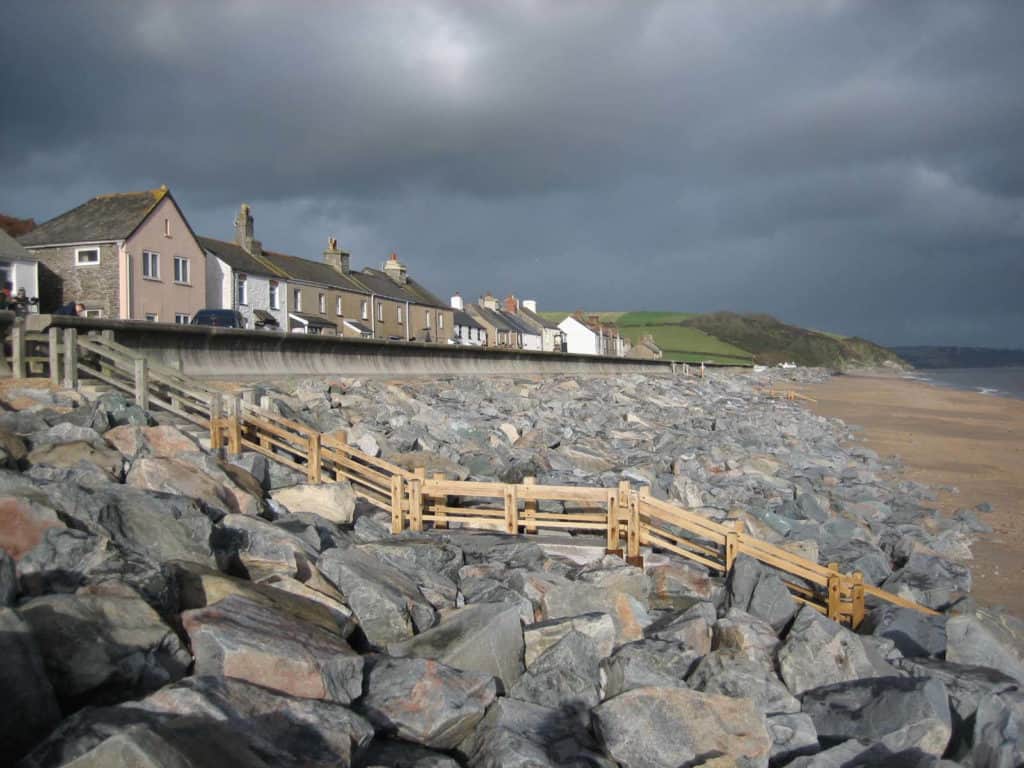
Use secondary data to find the rock type used and its density. This information can then be used to calculate Hudson’s equation (see Data Analysis).
Here are some densities of rocks often used for rip-rap.
| Mean density (tonnes/\(m^3\)) | |
| Granite | 2.64 |
| Basalt | 2.99 |
| Limestone | 2.55 |
Human impact of coastal management
7. Bi-polar analysis
Construct your own environmental quality assessment. Choose a series of opposing positive and negative statements. For each location that you visit, decide which score to give for each factor. A pilot survey will show whether the criteria you have chosen are appropriate. Here is an example
| BI-POLAR EVALUATION OF SEA DEFENCES | ||||||
| NEGATIVE EVALUATION FACTOR | -2 | -1 | 0 | +1 | +2 | POSITIVE EVALUATION FACTOR |
| Vulnerable to erosion | Effective protection against erosion | |||||
| Vulnerable to overtopping | Effective against overtopping | |||||
| Ugly | Beautiful | |||||
| Poor access to beach | Good access to beach | |||||
| High risk safety hazard | No obvious safety risk | |||||
| Short lifespan | Good life expectancy | |||||
| High levels of disturbance caused to local people during construction | Low levels of disturbance caused to local people during construction | |||||
| Disturbs natural coastal processes and habitats | Maintains natural coastal processes and habitats |
7. Questionnaires
Questionnaires are useful for finding out more about people’s
- characteristics (e.g age, sex, place of residence)
- behaviour (e.g. usage of the coast)
- attitudes (e.g. do they agree with a scheme for managed retreat?)
An effective questionnaire contains a mixture of closed and open questions:
Closed questions: answers are limited to single words, numbers of listed options
e.g. “Have you heard of the new protection scheme planned for Borth Beach?
Possible answers YES or NO
Closed questions can also be given as a statement. Responses are limited to positions on a scale. There are two ways of presenting statements:
(i) Semantic differential scale – use pairs of words and a scale from negative to positive.
e.g. What do you think of the beach protection at Beesands?
Ugly -2 -1 0 +1 +2 Beautiful
Dangerous for the public -2 -1 0 +1 +2 Safe for the public
A long-term solution -2 -1 0 +1 +2 A temporary fix
(ii) Likert scale – ask participants whether they agree or disagree with a series of statements. Use statements with a balance of positive and negative.
e.g. “The coastal defences at Sandsend will protect the town for the next 30 years
Answers: Strongly agree / Agree / Don’t know / Disagree / Strongly disagree
(iii) Rating – ask participants to rank a small number of categories from most important to least important.
e.g. What do you think are the most important reasons for protecting the coast at Tywyn? Please rank the following statements from 1 (most important) to 6 (least important)
Answers: protect houses, protect main road, reduce flood risk, protect the beach, protect natural habitats, protect farmland
Open questions: responses may be long and detailed. Often it is a good idea to word the question so that people could respond with positive answers, negative answers or a mixture of the two. Asking participants to focus on a specific area or time frame may be more effective than just asking “Any other comments?” or “What do you think about the coast?” at the end of a questionnaire.
e.g. “Do you think the proposed scheme will protect Borth for the next 40 years?”
8. Cost-benefit analysis
Cost benefit analysis assessments of coastal defences take into account the cost of a defence and the value of the land (and properties) that it protects.
Cost Benefit = Value of land protected /Cost of defence over x years
Shoreline Management Plans and Environment Agency documentation can provide you with values for the cost of the different types of sea defence in your study area. Different sea defences require different levels of maintenance than others (e.g. rip rap groyne is cheaper to maintain than a wooden groyne) and so this should also be factored in. The cost of maintenance over a set time year period should be found in the same documentation and used for your calculation.
Land use type can be recorded as a tally as shown above, values for different types of land use can also be found in secondary sources.
For a more representative cost benefit analysis, consideration of different house and business prices depending on the location along the coastline should be taken into account. Distance away from the sea defence and height above it should also be taken in to account when surveying land use. High resolution maps are available that show individual buildings and height above sea level.
Risk and vulnerability
9. Risk mapping
Flood risk at a coastal location can be quantified by taking into account the likelihood of flooding occuring and the severity of a breach or overtopping of sea defences.
Flood risk = likelihood x severity
Determining likelihood of flooding
In its simplest form likelihood can be scored depending on the estimated height of the sea defence above a high tide or storm tide. The table below shows how the height of the defence can be categorised.
| Approx height above storm tide / high tide (m) | Likelihood |
|---|---|
| 0-1 | 5 |
| 1-2 | 4 |
| 2-3 | 3 |
| 3-4 | 2 |
| 4-5 | 1 |
There are a range of ways to increase the accuracy of this piece of data collection:
- using supporting pictures to clearly see the height that storm surges reach on a defence
- using people as guidance for heights
- lowering a tape measure from the top of the defence (be aware of the risks involved in fieldwork where there are exposed drops of any height and take suitable precautions as required.)
Evaluating the impact (and severity) of flooding behind coastal defences
Severity of coastal flooding can be determined by considering the properties that would be affected by flooding, especially their economic value or worth if damaged.
Choose a small number of categories for the types of land use. Sample a representative number of locations behind the coastal defences. At each location, tally the number of different types of land use found. Use your tally chart to find the most common land use at each location. (i.e. the mode). This modal land use and its associated score can then be used in the flood risk calculation.
| Land use type | Tally | Score |
|---|---|---|
| High-status retail (e.g. department stores), high tech industry, offices | 5 | |
| High value housing, low order retail, possibly small scale industry/cafes/pubs | 4 | |
| Low value housing, small businesses (small convenience stores, independent garages, storage facilities) | 3 | |
| Open space (car parks, derelict land, parks, allotments) | 2 | |
| Other | 1 |
To show the spatial change of land use along your stretch of coastline, the buildings can be marked on a map using colours or symbols for different types of land use.
Secondary data sources
1. Wave and wind data
This can be found at
2. Shoreline management plans
Shoreline management plans are an essential source to find our more about about erosion and other coastal processes in your chosen length of coastline.
Projections of coastal flooding as a result of sea level rise can be modelled using Flooding Firetree.

Secondary and Further Education Courses
Set your students up for success with our secondary school trips and courses. Offering excellent first hand experiences for your students, all linked to the curriculum.
Group Leader and Teacher Training
Centre-based and digital courses for teachers