All Geography starts with someone going into the field to find out what’s there. This section will help you to gather the primary data (data you collect yourself) and secondary data (data collected by someone else) that will support your analysis and conclusions.
| Type of data | Primary data collection technique | Secondary data collection source |
|---|---|---|
| Beach morphology | Beach profiles Coarse sediment analysis: size and shape Fine sediment analysis: size and shape Longshore drift: direction and strength | Maps and aerial photogaphs Historical maps and photographs |
| Wave size, direction and frequency | Wave survey | Wave and wind data |
| Infiltration rate | Infiltration survey | |
| Sand dune morphology | Frontal dune profile Measurements of blowouts Vegetation characteristics | Historical maps and photographs |
Primary Data Collection
1. Beach profiles
Beach profiles use distance and angle measurements to help you investigate the shape of the beach.
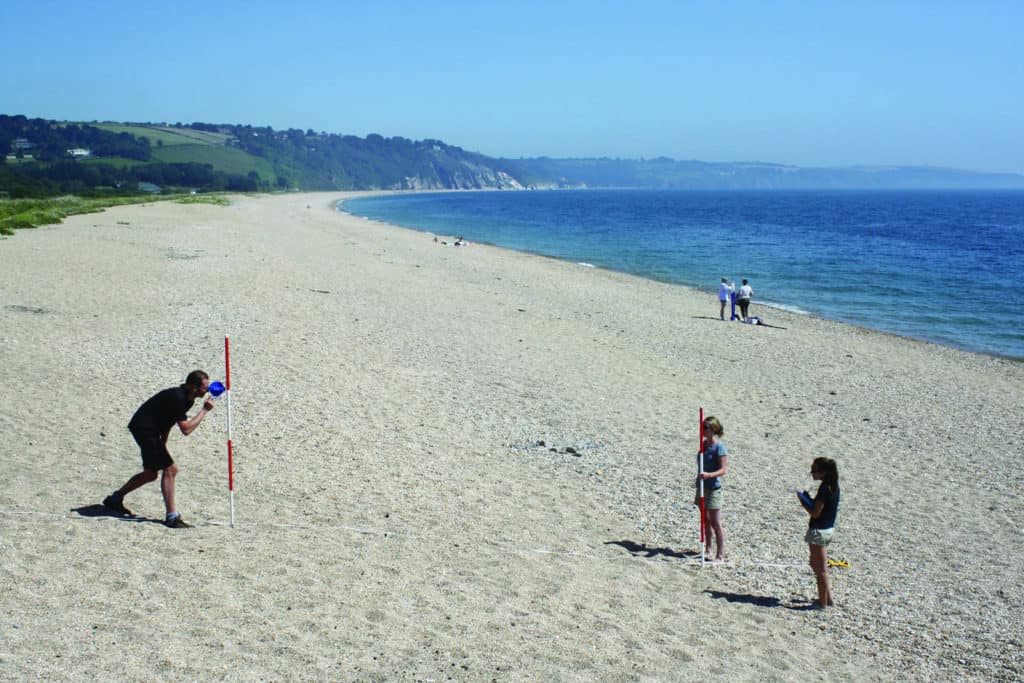
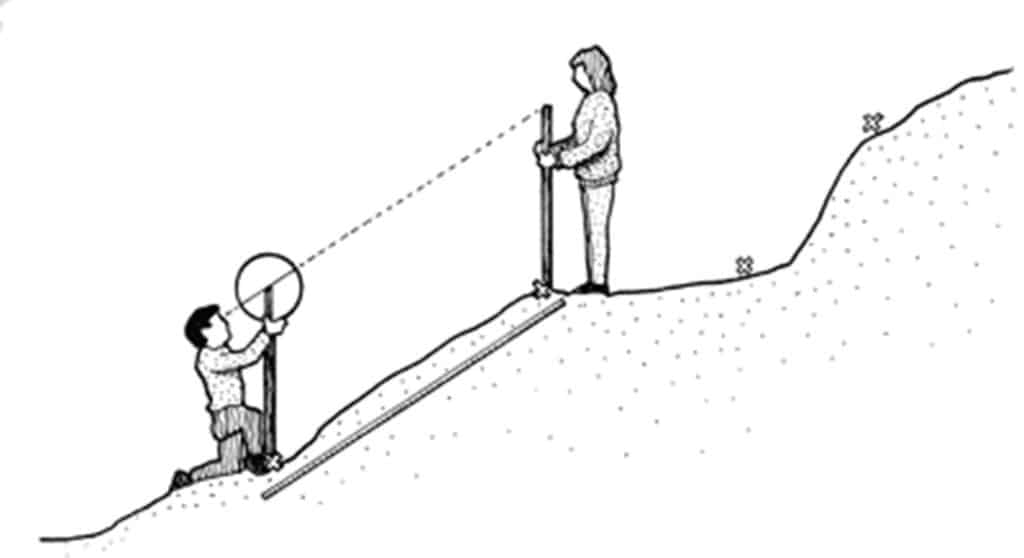
Follow a straight transect line from the edge of the sea to the end of the active beach. Split the line into segments where the slope angle changes. Each reading is taken from from break of slope to break of slope.
- Person A stands at a safe distance from the edge of the sea holding a ranging pole
- Person B stands holding a second ranging pole further up the beach where there is a break of slope
- The distance between the two ranging poles is measured using a tape measure
- The angle between matching markers on each ranging pole is measured using a clinometer
- Repeat this process at each break of slope until the top of the beach is reached
Beach profiles can also be used to calculate cross-sectional area and the amount of beach material present.
2. Coarse sediment analysis
Random, systematic and/or stratified sampling is used to take a sample of beach sediments (such as sand, gravel and pebbles). The measurement technique used depends on the size of the sediments.
Measuring size
The size and shape of coarse sediments can be measured on the beach. You do not have to take any sediments from the beach to the lab.
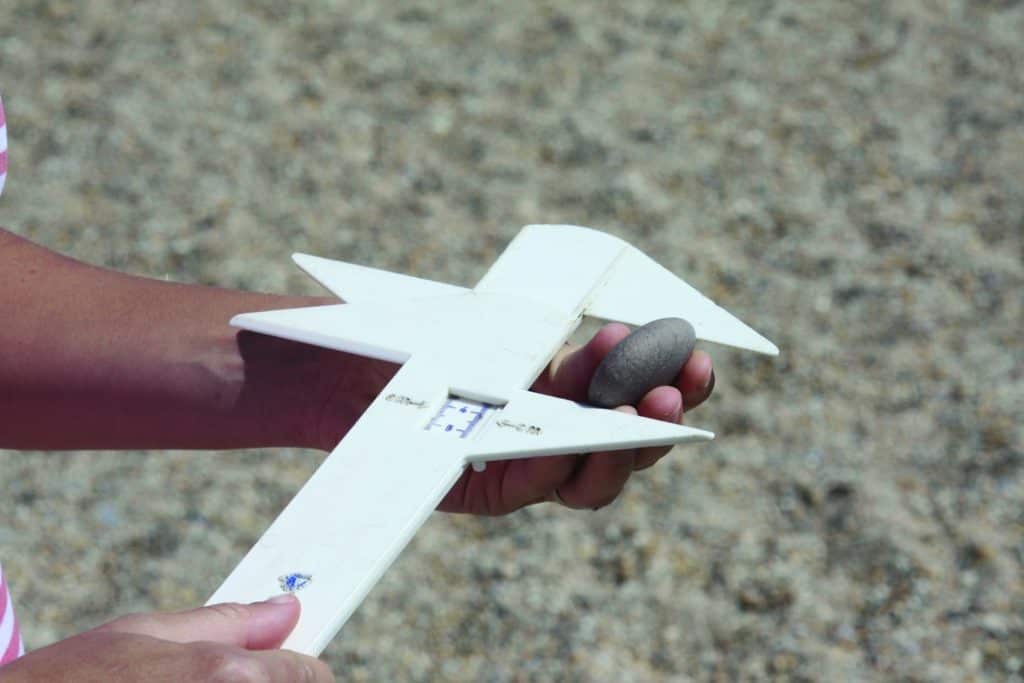
Use rules or calipers to measure the a, b and c axes of each pebble.
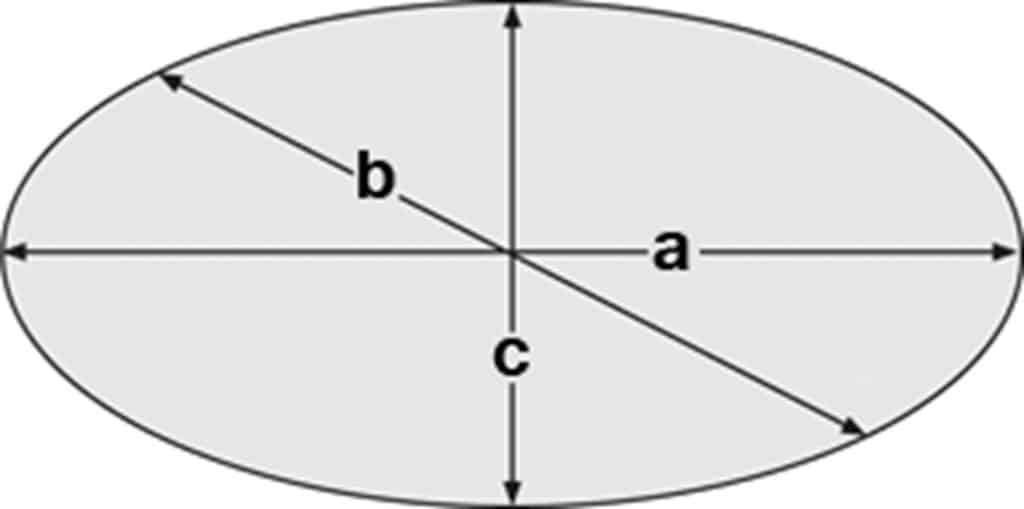
- The a-axis is the longest axis
- The b-axis is the widest axis at right angles to the a-axis.
- The c-axis is the shortest axis
Measuring shape
The simplest way to record pebble shape is to classify the stone as very angular, angular, sub-angular, sub-rounded, rounded or very rounded using a Power’s Scale of Roundness. This is judged by eye.
Using a protractor or concentric circle card, measure the minimum radius of curvature. This is the sharpest corner on the a-axis.

Alternatively use the pebble size measurements (a, b and c axes) to calculate Zingg’s shape classification, Krumbein’s Index of Sphericity or Cailleux’s Flatness Index (see Data Analysis). Use the a-axis and minimum radius of curavture to calculate Cailleux’s Roundness Index.
3. Fine sediment analysis
Samples of fine sediments (clay,silt and sand) will need to be taken from the beach to the lab. Each sample should be placed in a sealed plastic bag and accurately labelled.
Use a set of graduated sieves can be used to sort sediment samples into different size categories (in millimetres or as phi sizes).
The sieves are arranged in decreasing mesh diameter with the largest at the top. The sediment sample is placed in the top sieve then the sieves are shaken to sort the sediment into the various sieves. The mass of sediment in each sieve is measured using scales and the percentage of the total sample can be calculated.
4. Longshore drift: direction and strength
Select 30-50 pebbles of different shapes and sizes from the beach. Use waterproof paint to mark each pebble. Spread the pebbles out in the swash zone, and place a marker further up the beach to show the start point for the pebbles. After 20 minutes find as many pebbles as you can, and measure how far each has moved from the start point.
After 20 minutes, you may find that some of the pebbles will have disappeared from the beach or moved in a different direction to the others. This does not mean that your results are ‘wrong’. Record what happened to each pebble (including ‘disappeared’).
Repeat the experiment at least 3 times, or until you judge that the running mean for distance travelled by a pebble indicates that you have taken an adequate sample.
5. Wave survey: height and frequency
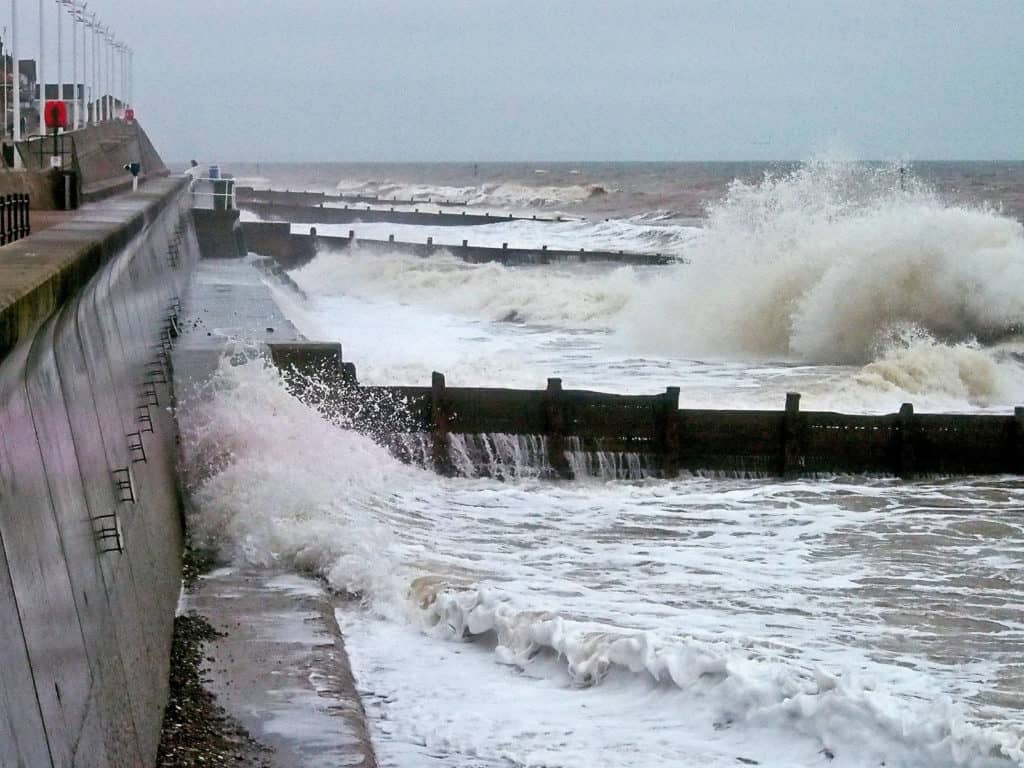
Wave height can be estimated by using a groyne or other marker on the beach to judge the height of at least 20 waves. Calculate mean wave height.
Wave frequency can be estimated by counting the number of waves breaking on the shore in 10 minutes. Calculate mean wave frequency per minute.
Data you have collected for wave height and wave frequency can be used to calculate wave energy (in joules).
The relative strength of swash and backwash can be assessed. Monitor the waves breaking on the shore for 10 minutes. Measure the time (in seconds) that the swash of each wave moves upwards. Note whether the backwash of each wave either drains into the beach material, runs back down the shore before the next wave arrives or interferes with the swash of the next wave.
6. Infiltration survey
Infiltration rate can measured in litres of water per second. Use an infiltration tube to measure how long it takes a known volume of water to move into a known surface area of beach sediment. Compare infiltration rates at different locations, and take sufficient replicates at each location.
Push the infiltration tube into the sand, gravel or pebbles until it forms a seal. You can use wood and a mallet to push the tube in evenly. Try to avoid stamping around the tube, particularly on sandy beaches.
Pour a known volume of water (such as 1 litre) into the tube. Time how long it takes for the water to infiltrate into the beach. Since infiltration is often very rapid, you may need to run pilot surveys with different volumes of water.
Beach angle and sediment size should also be recorded at each infiltration sampling location.
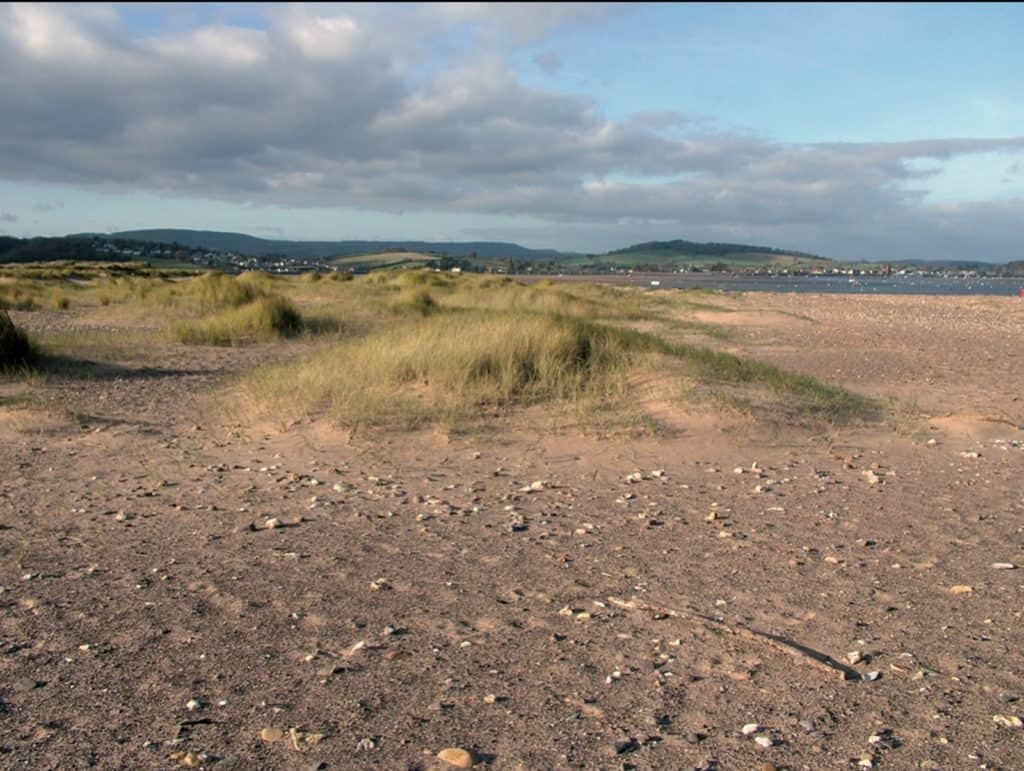
7. Sand dune morphology
Frontal dune profile
Take measurements along the foredune ridge at regular intervals. Use the slope profiling method for beaches to measure the height and angle of the foredunes from high-tide level inland to the highest point of the foredune ridge, including any embryo dunes.
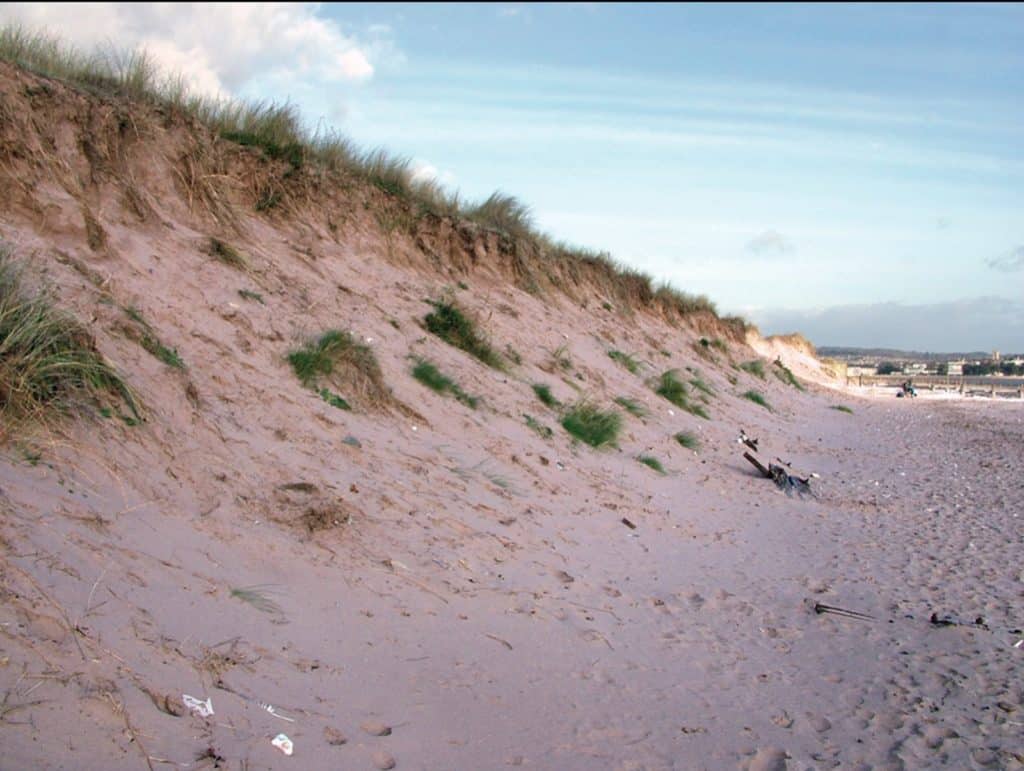
Since you are only taking profile readings over a short distance, be careful to measure every slope change. Eroded foredunes may, for example, have a stepped or concave profile, caused by wave erosion and slumping.
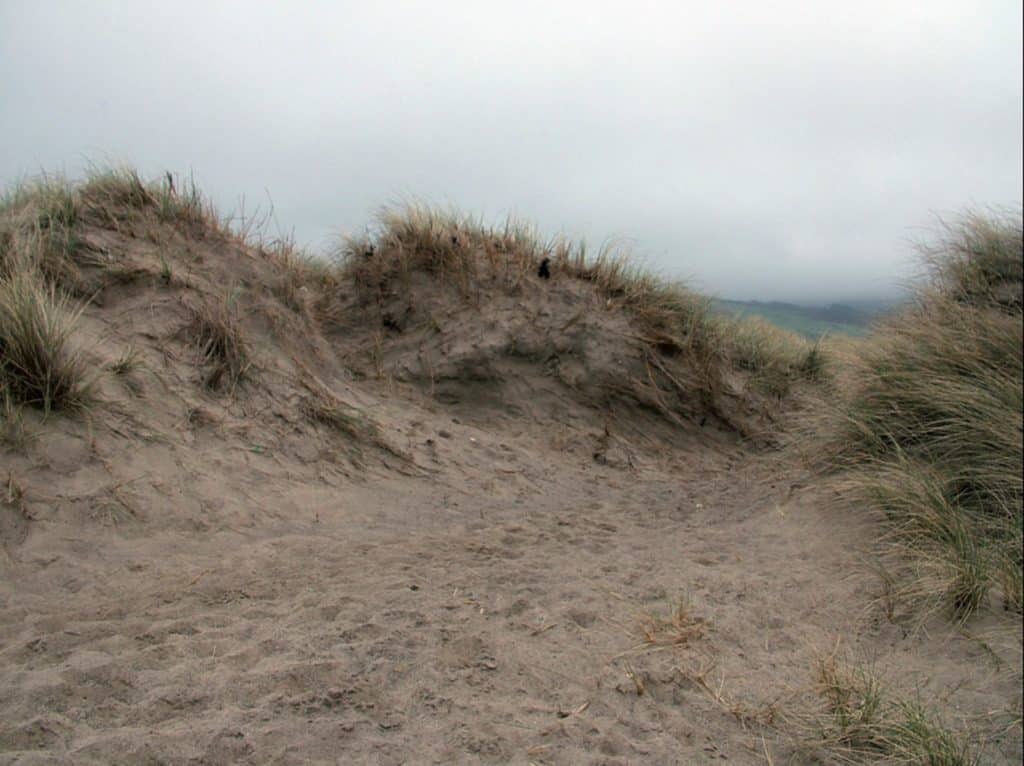
Blowout measurements
A blowout starts as a small gap in the vegetation, which may be created naturally (e.g. by rabbits burrowing) or by people (e.g. path trampling). Sand is exposed to wind and is blown away. If the rate of sand erosion is greater than the rate of sand accumulation, then the blowout will grow.
Use tape measures to measure the length and depth of the blowout. Use the slope profiling technique to measure the shape and length of slopes.
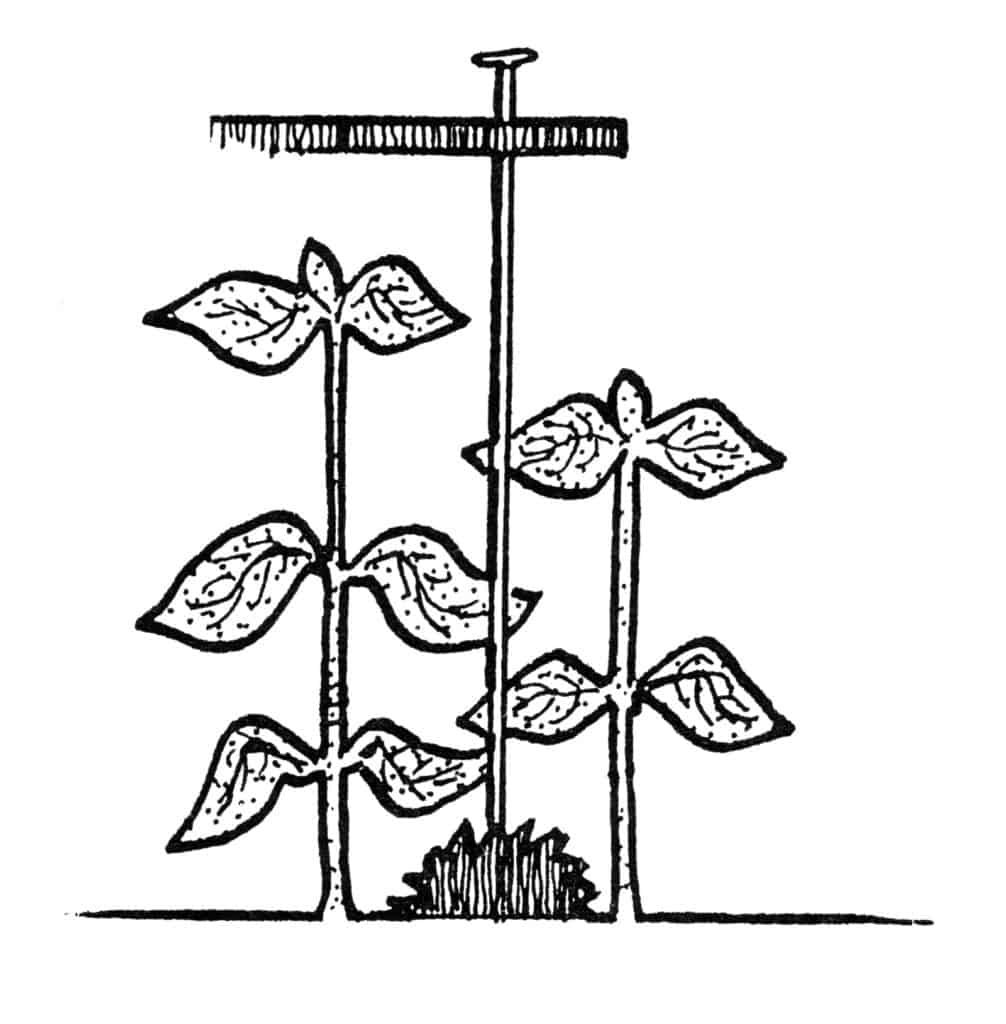
9. Vegetation characteristics
Vegetation cover in the foredunes or in and around a dune blowout can be measured using a frame quadrat or a point quadrat. Use a gridded quadrat to count the number of grid squares containing vegetation.
In taller vegetation, a point quadrat is more practical. To sample vegetation, pass the pin through the bar of the quadrat, and count the number of times that the pin hits vegetation.
Secondary data sources
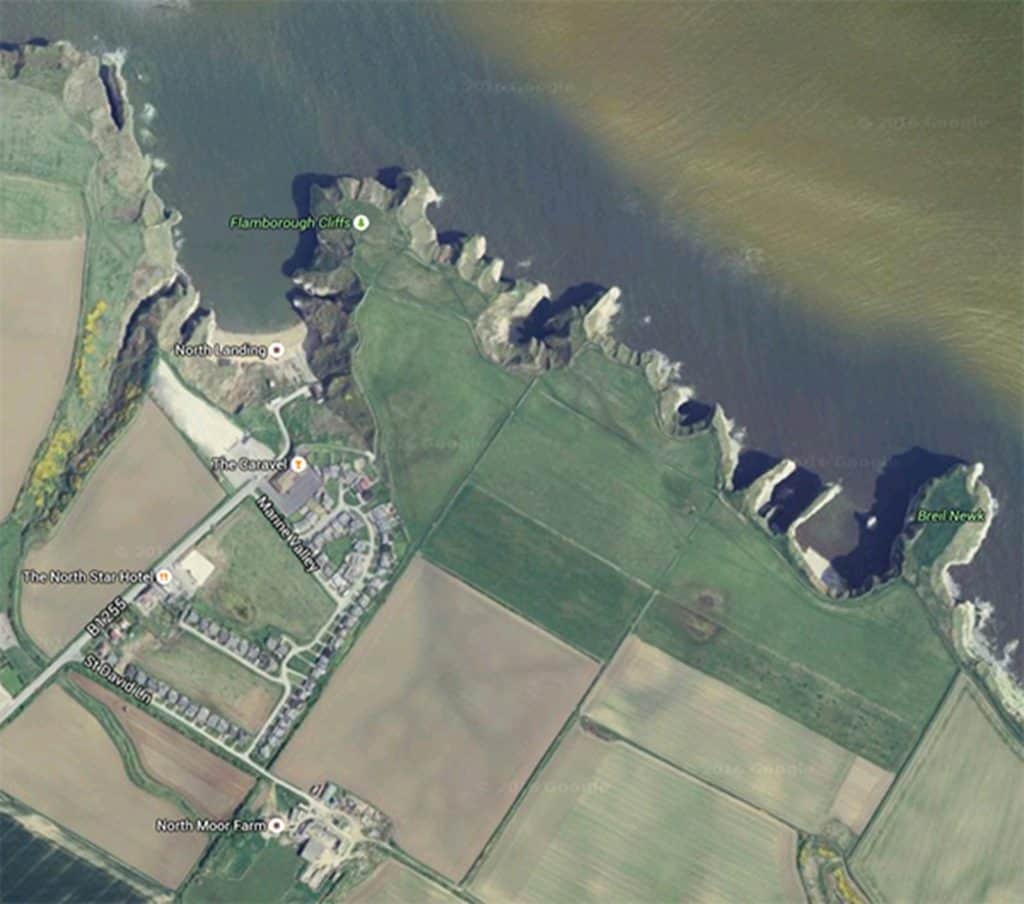
1. Maps and aerial photographs
Maps and aerial photographs (including Google Earth) are useful for assessing the planform of coastal landforms, such as cliffs. For example, using the measurement tools on ArcGIS or Bikemap, the length, width, shape and area of Flamborough Head in East Yorkshire can be judged.
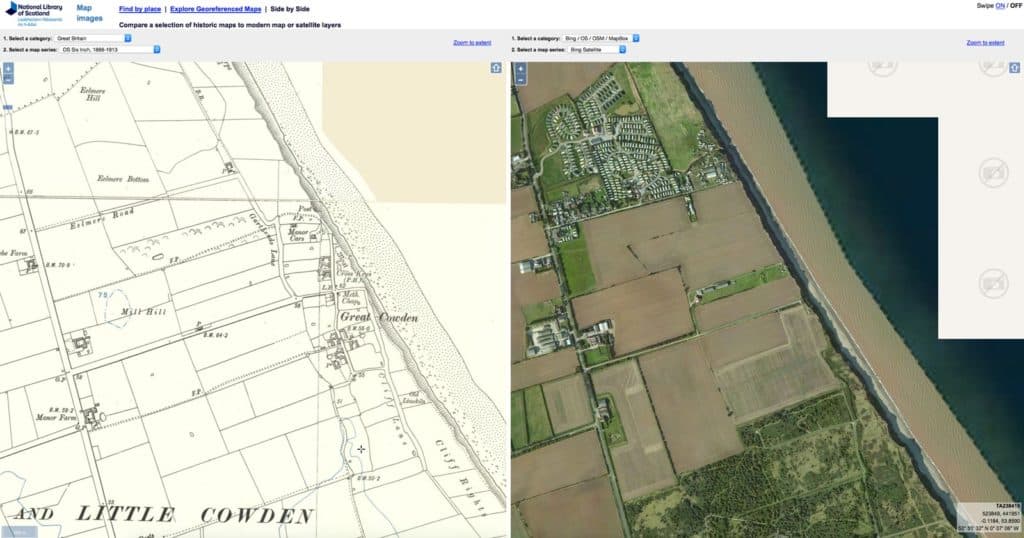
2. Historic maps and photographs
Old Ordnance Survey maps from across England, Wales and Scotland can be browsed at the National Library of Scotland archive
Use the option “Side by Side” to compare historic maps with present-day maps and aerial photographs. Below shows an example of how the large scale maps showing field boundaries could be used as a source of data on how much land has been eroded around the East Yorkshire village of Great Cowden since the early 20th century. Much of the village shown in the 1908 map (on the left) is no longer in existence in the present-day aerial photo (on the right).
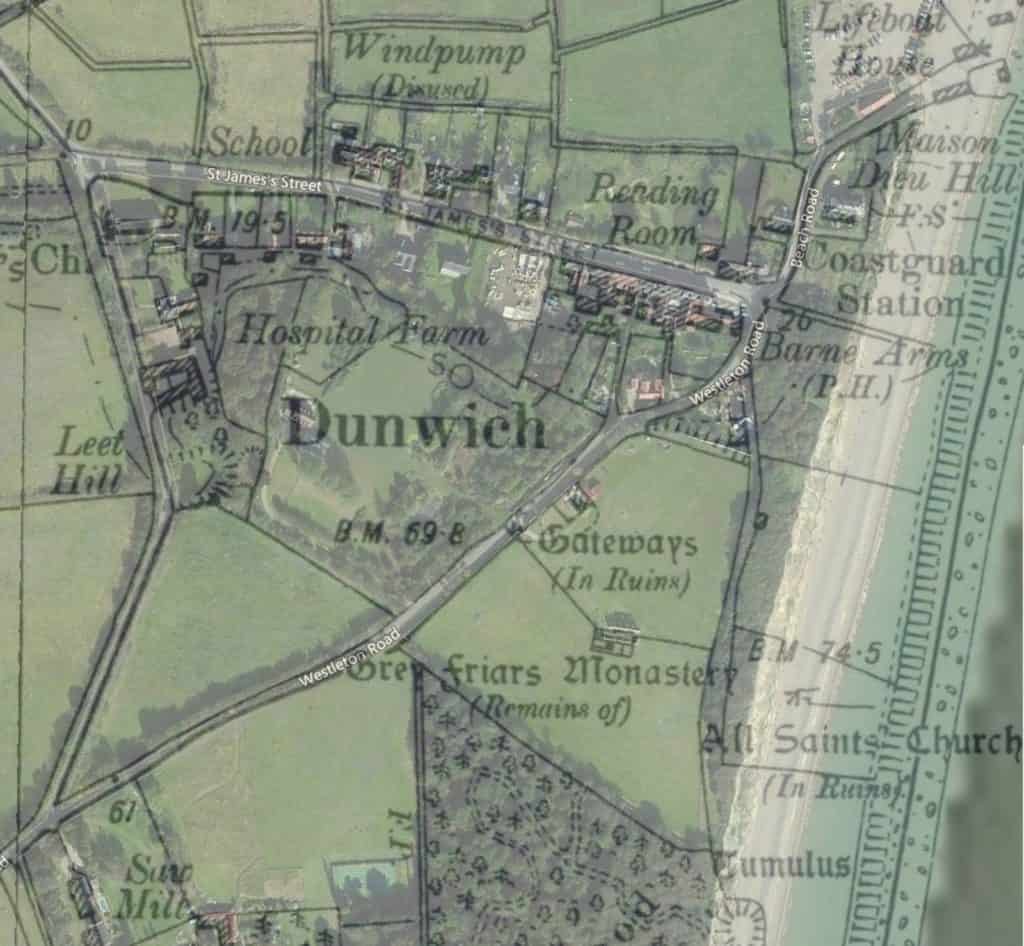
Historic maps can also be overlaid over present-day views. The example below shows a 1905 map overlaid over a recent aerial view. The loss of land, roads and buildings on the eastern side of the view is clear. Historic erosion rates could be measured from these views.
3. Wave and wind data
This can be found at
4. Shoreline management plans
Shoreline management plans are an essential source to find our more about about erosion and other coastal processes in your chosen length of coastline.
Projections of coastal flooding as a result of sea level rise can be modelled using Flooding Firetree.

Secondary and Further Education Courses
Set your students up for success with our secondary school trips and courses. Offering excellent first hand experiences for your students, all linked to the curriculum.
Group Leader and Teacher Training
Centre-based and digital courses for teachers