Present your findings with a range of quantitative and/or qualitative techniques. Each technique should be accurately drawn and appropriate for the information being presented.
Beach profile
A beach profile is a cross section of the beach from the top of the beach to the seashore. It shows distance on the x-axis and height above the seashore on the y-axis.
The distance and angle information for each facet of the beach can be plotted by hand or using a spreadsheet program to create a beach profile. See image below for an example of this. Alternatively, complete beach profiles can be presented around a map.
The y-axis is often exaggerated on a beach profile.
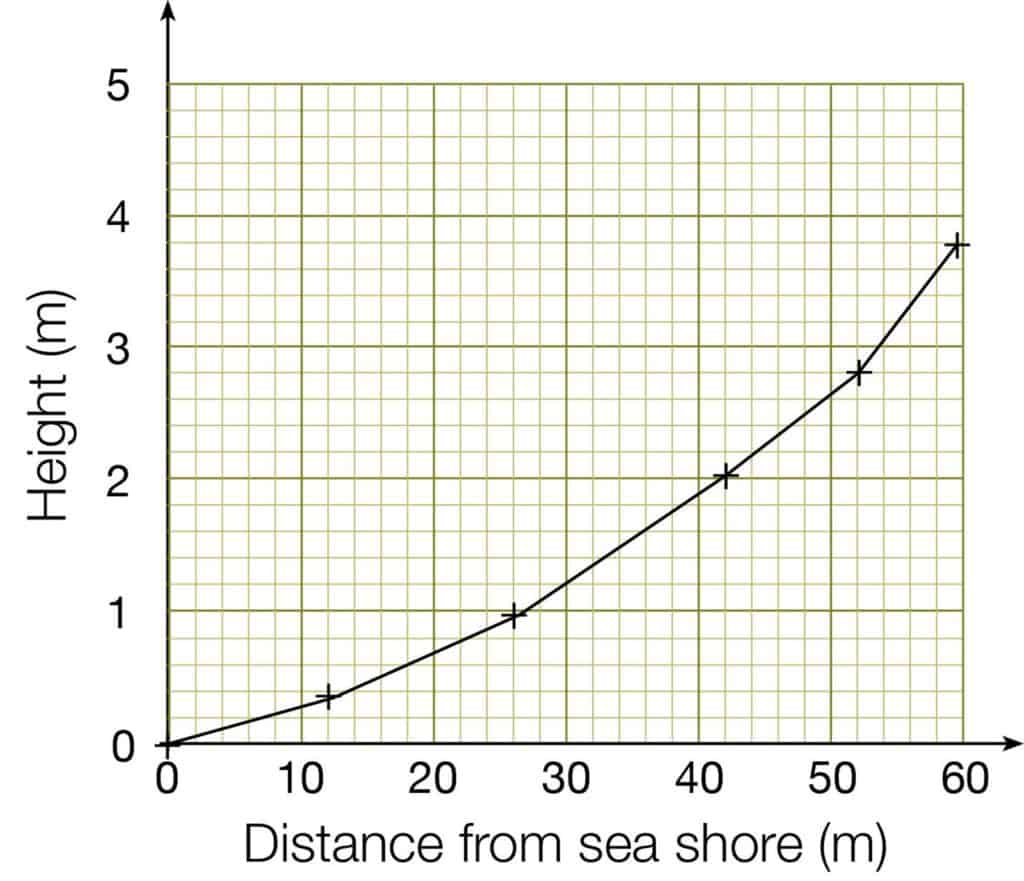
The profile graph can be used to calculate total cross-sectional area.
Bar charts
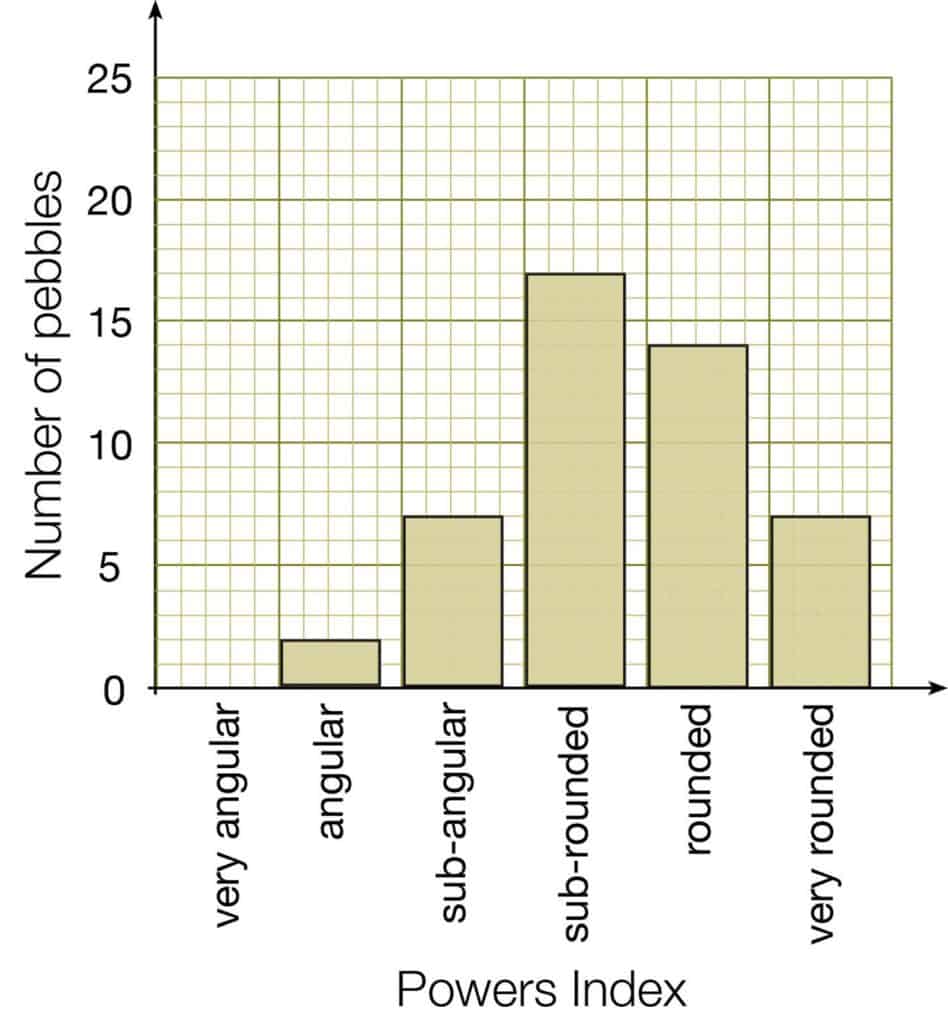
Use a bar chart when you want to compare different places, such as sites. The x-axis has labels. Leave a gap between bars. This is a basic method of data presentation. It could be made more sophisticated by, for example, arranging several bar charts on map.
Here is an example of pebbles sampled at one site put into Powers Index roundness categories.
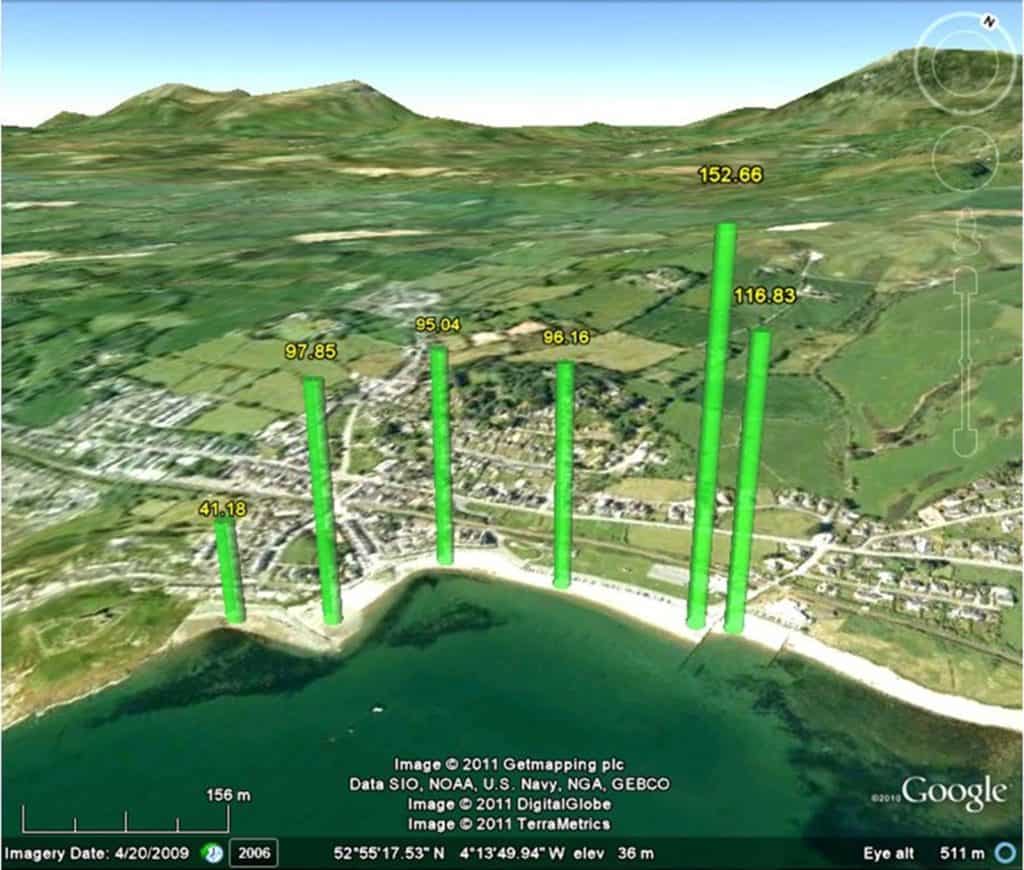
Proportional bars representing total cross-sectional area can also be geo-located.
Divided bar charts
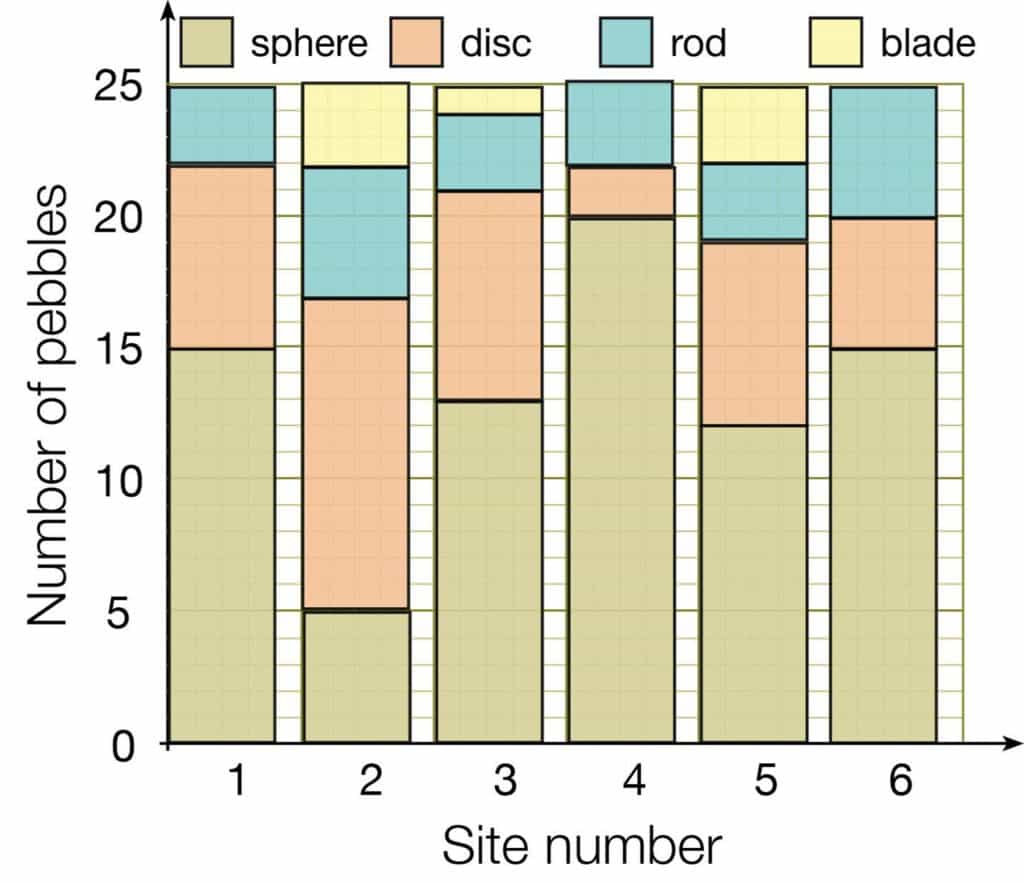
Divided bar charts show the total number of items and how many are in each category. The x-axis has labels. Leave a gap between the bars.
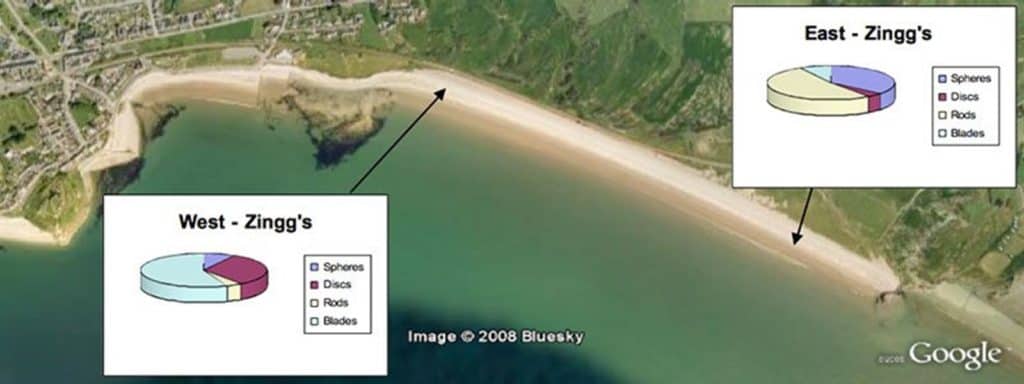
Here a student has sampled 25 pebbles at 6 sites, and put the pebbles into the four Zingg shape categories.
Categories can also be geo-located, here using pie charts
Histograms
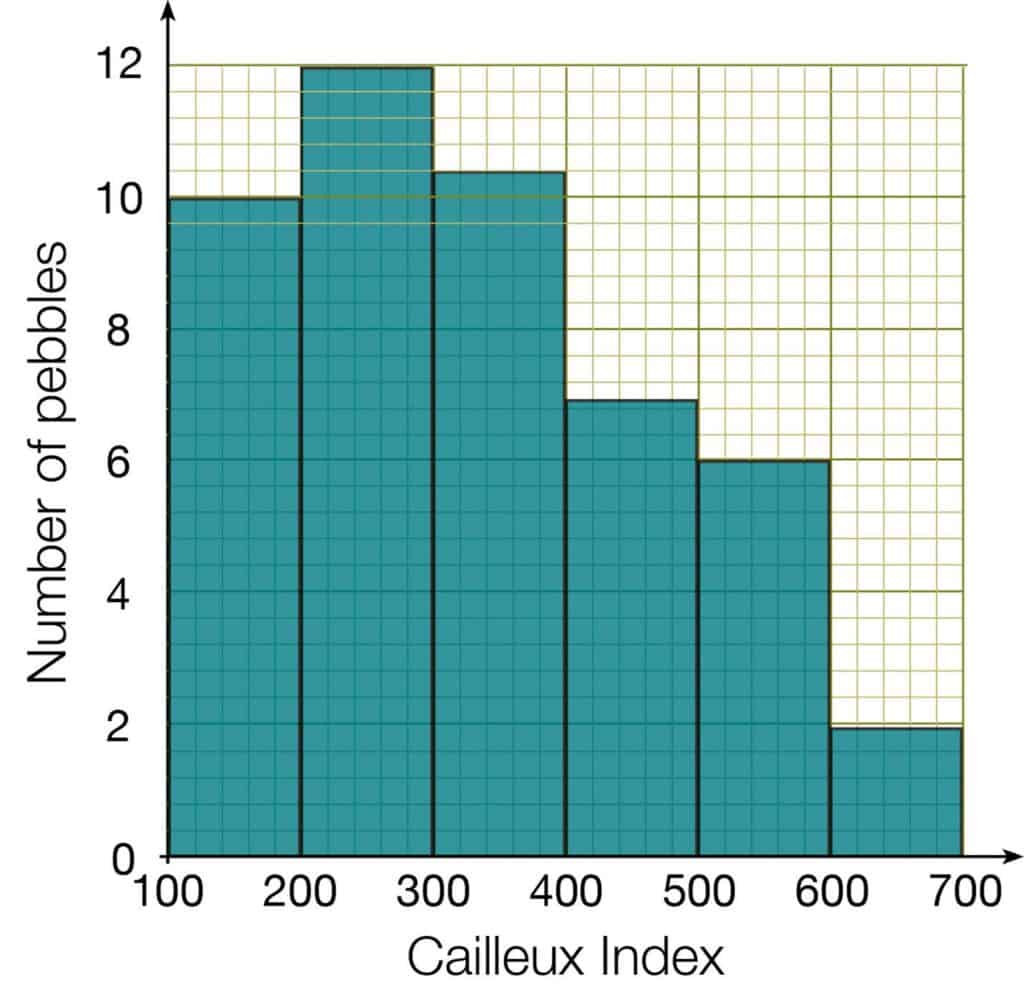
Use a histogram when your data is divided up into classes, such as lengths 0-2cm, 2-4cm, 4-6cm, etc. The x-axis has numbers. Do not leave a space between the bars.
In this example, a student has measured the calculated the Cailleux Index for a sample of pebbles at one site.
Box and whisker plots
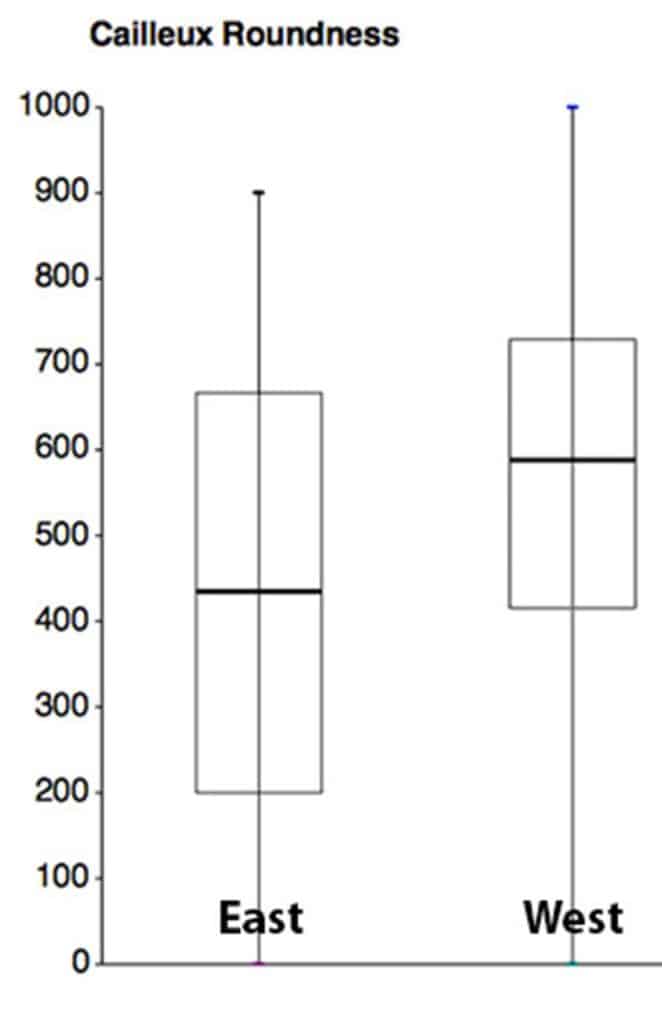
As a numerical index of roundness, Cailleux’s Index may be presented using techniques such as box and whisker plots.
Scattergraphs
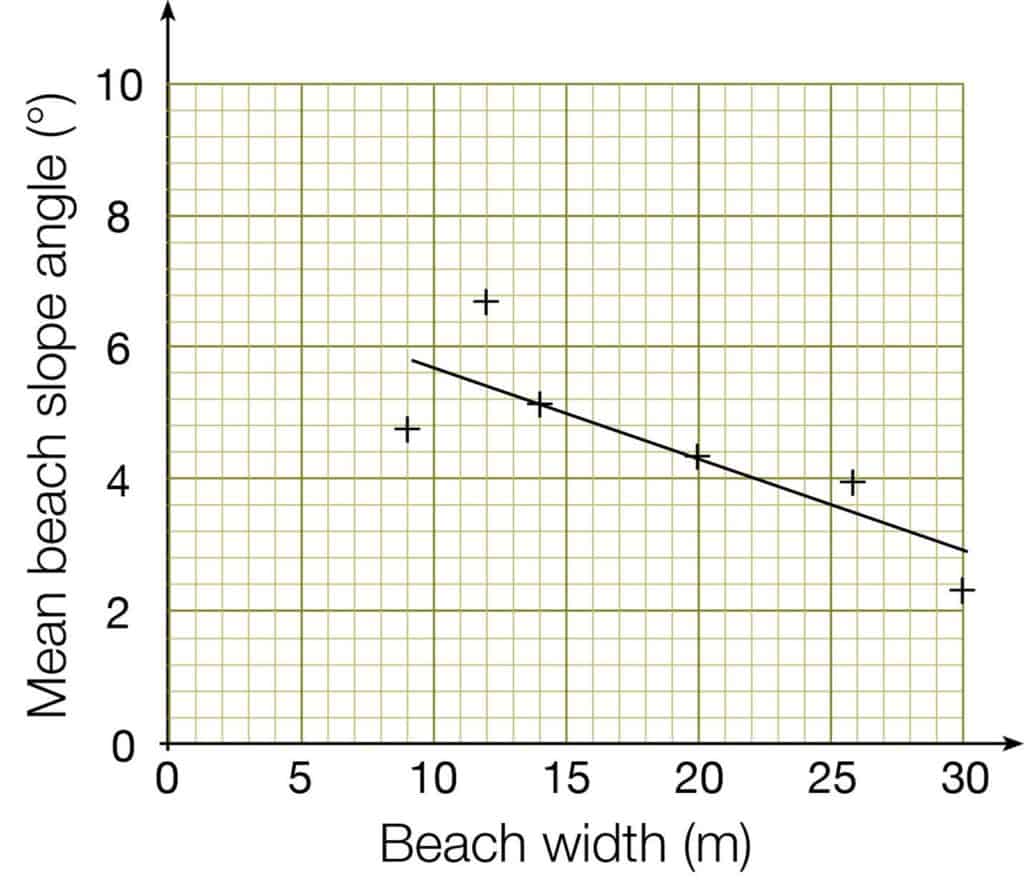
Plot a graph with one coastal variable on the x-axis and another on the y-axis. Here is a scattergraph of beach width (the distance from the seashore to the top of the beach) plotted against mean beach slope angle. Don’t join up the points. But you can draw a best-fit line. Try to make sure that there are as many points above the line as there are below the line.

Secondary and Further Education Courses
Set your students up for success with our secondary school trips and courses. Offering excellent first hand experiences for your students, all linked to the curriculum.
Group Leader and Teacher Training
Centre-based and digital courses for teachers