Present your findings with a range of quantitative and/or qualitative techniques. Each technique should be accurately drawn and appropriate for the information being presented. Here are some suggestions.
Till fabric analysis histograms
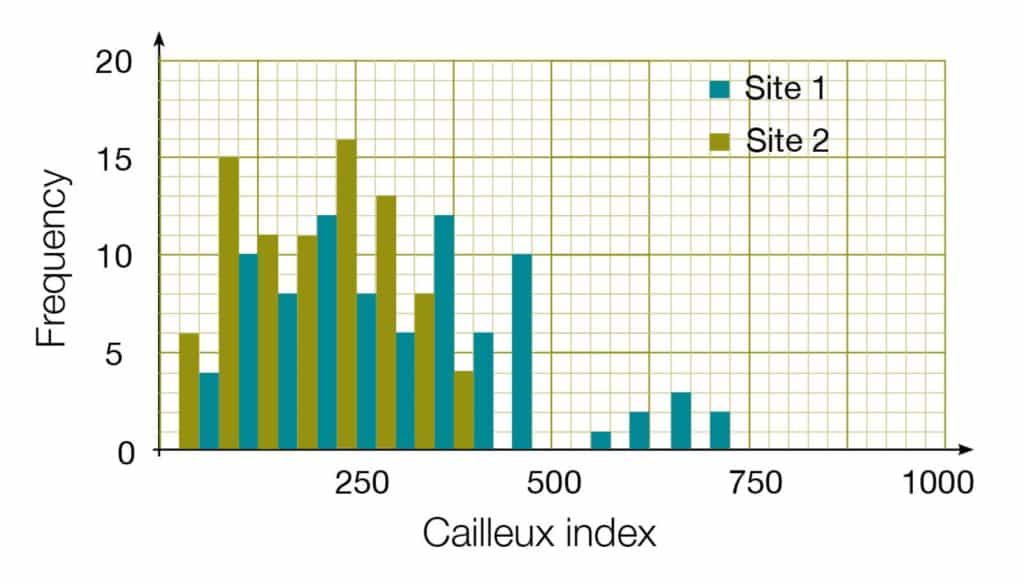
Histograms can be used to compare clast shape (e.g. Power’s Index) or clast roundness (e.g. Cailleux Index) for more than one site. The histogram below shows Cailleux Index for two separate deposits which are suspected to be different in some way. The raw data in the table has been plotted onto a single histogram.
| Cailleux Index | Frequency at Site 1 | Frequency at Site 2 |
|---|---|---|
| 0-50 | 0 | 6 |
| 51-100 | 4 | 15 |
| 101-150 | 10 | 11 |
| 151-200 | 8 | 11 |
| 201-250 | 12 | 16 |
| 251-300 | 8 | 13 |
| 301-350 | 6 | 8 |
| 351-400 | 12 | 4 |
| 401-450 | 6 | 0 |
| 451-500 | 10 | 0 |
| 501-550 | 0 | 0 |
| 551-600 | 1 | 0 |
| 601-650 | 2 | 0 |
| 651-700 | 3 | 0 |
| 701-750 | 2 | 0 |
| 751-800 | 0 | 0 |
| 801-850 | 0 | 0 |
| 851-900 | 0 | 0 |
| 901-950 | 0 | 0 |
| 951-1000 | 0 | 0 |
Till fabric analysis rose diagrams
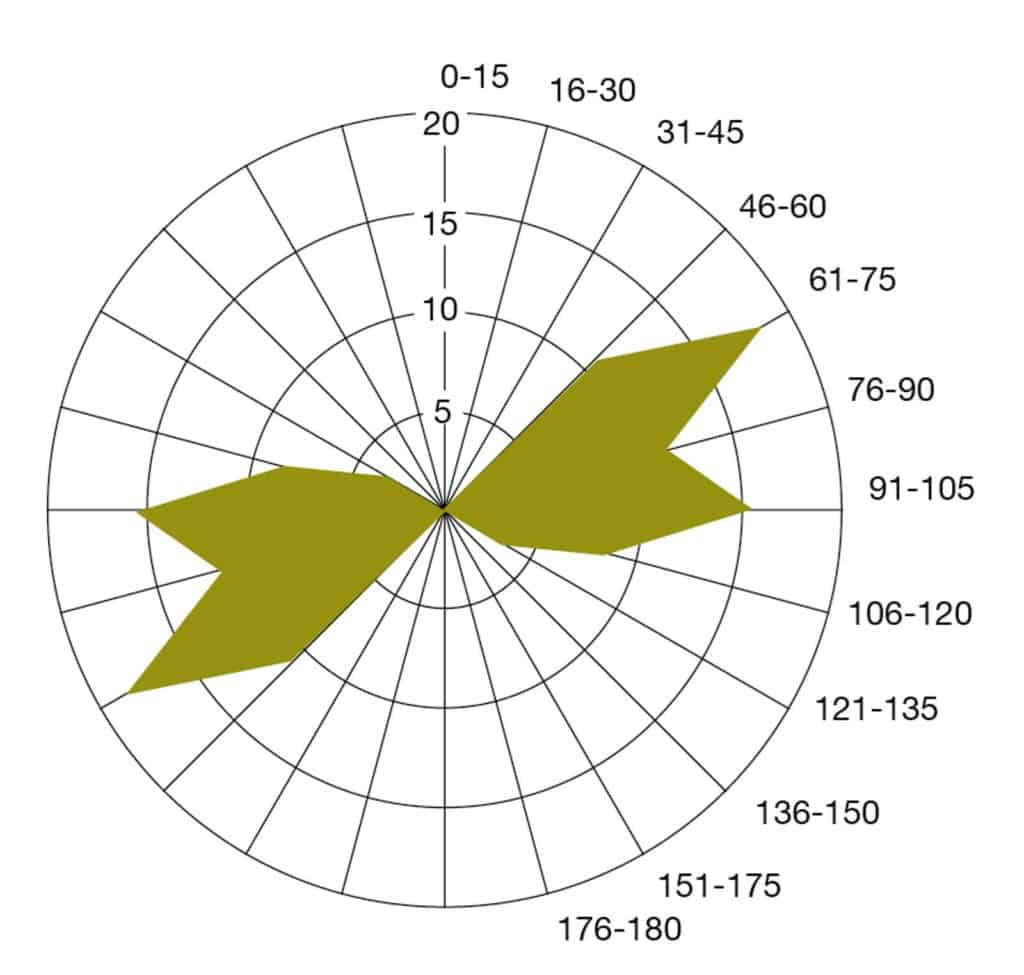
Rose diagrams can be used to present data on clast orientation. The raw data in has been sorted into 15° intervals, as shown in the table.
| Clast orientation (°) | frequency |
|---|---|
| 0-15 | 0 |
| 16-30 | 0 |
| 31-45 | 0 |
| 46-60 | 0 |
| 61-75 | 11 |
| 76-90 | 18 |
| 91-105 | 12 |
| 106-120 | 16 |
| 121-135 | 6 |
| 136-150 | 3 |
| 151-175 | 0 |
| 175-180 | 0 |
Plot these results onto the right-hand side of the rose diagram.
Since each orientation will have two values 180° apart, insert a mirror image of the area itself across the 180° line.

Secondary and Further Education Courses
Set your students up for success with our secondary school trips and courses. Offering excellent first hand experiences for your students, all linked to the curriculum.
Group Leader and Teacher Training
Centre-based and digital courses for teachers