All Geography starts with someone going into the field to find out what’s there. This section will help you to gather the primary data (data you collect yourself) and secondary data (data collected by someone else) that will support your analysis and conclusions.
| Type of data | Primary data collection technique | Secondary data collection source |
|---|---|---|
| Economic inequalities | Shopping basket survey Clone Town surveys Retail value Questionnaires Pedestrian footfall | Jobs data House prices Index of Multiple Deprivation Broadband availability |
| Social inequalities | Accessibility survey Crime surveys Bus index | Education data Crime data Index of Multiple Deprivation Accessibility by road |
| Environmental inequalities | Environmental quality assessment Building decay survey | Environment data |
Economic inequalities
1. Shopping basket survey
A shopping basket survey compares the prices of a small number of groceries in several shops.
These surveys are useful when comparing the price of products available in shops in particular areas. They are also useful when comparing different rural settlements, contrasting outlying villages with a nearby town, or investigating the phenomenon of “food deserts” in some inner cities.
You could combine the shopping basket survey data with questionnaire data (e.g. access to a car, shop use such as use of online shopping, eating habits such as fruit and vegatable intake) plus secondary data like deprivation and travel distances derived from a map.
2. Clone Town survey
The New Economics Foundation (NEF) have argued that shopping streets in Britain are steadily becoming more similar. These Clone Towns are dominated by a narrow range of chain stores rather than independent shops.
Use a GOAD map and/or a pilot survey of the town to determine the boundaries of the shopping areas of each town. Include all indoor shopping centres.
Visit all streets in the shopping area and categorise every shop into 1 of 25 categories using the NEF survey form on page 45 of this report. Carry out this work methodically, making a careful note of when streets have been surveyed. Use the formula on page 44 of the same report to determine whether your town is a Clone Town or not.
3. Retail value
As well as making an overall survey of the degree of cloning, it is possible to look at individual streets of the town centre in more detail. There are likely to be areas of higher and lower retail quality. One way in which this can be done is to choose a study area, then score each shop within the area as follows
| Shop type | Score |
|---|---|
| Department store | 5 |
| High street chain | 4 |
| Independent specialist shop | 3 |
| Convenience store | 2 |
| Charity shop | 1 |
| Vacant retail premises | 0 |
This is based on the assumption that large shops like department stores act as ‘anchors’, attracting many shoppers, while smaller shops have a lower attractive pull.
Add all the scores together to calculate the retail value for the area.
Worked example
| Shop type | Score | Number in High Street | Number in Market Street |
|---|---|---|---|
| Department store | 5 | 3 | 0 |
| High street chain | 4 | 10 | 2 |
| Independent specialist shop | 3 | 7 | 7 |
| Convenience store | 2 | 2 | 2 |
| Charity shop | 1 | 0 | 6 |
| Vacant retail premises | 0 | 0 | 2 |
| TOTAL RETAIL QUALITY | 80 | 39 |
In this example, High Street has a higher retail value (80) than Market Street (39).
4. Questionnaires
Questionnaires are useful for finding out more about people’s
- characteristics (e.g age, sex, place of residence)
- behaviour (e.g. usage of the coast)
- attitudes (e.g. do they agree with a scheme for managed retreat?)
An effective questionnaire contains a mixture of closed and open questions:
Closed questions: answers are limited to single words, numbers of listed options
e.g. “Do you feel safe in Church Street at 8pm?
Possible answers YES or NO
Closed questions can also be given as a statement. Responses are limited to positions on a scale. There are two ways of presenting statements:
(i) Semantic differential scale – use pairs of words and a scale from negative to positive.
e.g. What do you think of the village of Horton-in-Ribblesdale?
Ugly -2 -1 0 +1 +2 Beautiful
Boring -2 -1 0 +1 +2 Lots to do
Dead -2 -1 0 +1 +2 Vibrant
(ii) Likert scale – ask participants whether they agree or disagree with a series of statements. Use statements with a balance of positive and negative.
e.g. “I do not feel in danger walking around Stokesley in the evening.
Answers: Strongly agree / Agree / Don’t know / Disagree / Strongly disagree
(iii) Rating – ask participants to rank a small number of categories from most important to least important.
e.g. What was your main reason you chose to live in this neighbourhood? Please rank the following statements from 1 (most important) to 6 (least important)
Answers: proximity to work, proximity to family and friends, proximity to schools, housing costs, pleasant environment, good place to raise children
Open questions: responses may be long and detailed. Often it is a good idea to word the question so that people could respond with positive answers, negative answers or a mixture of the two. Asking participants to focus on a specific area or time frame may be more effective than just asking “Any other comments?” or “What do you think about this town?” at the end of a questionnaire.
e.g. “Do you think this town will get better or worse in the next 20 years? Why?”
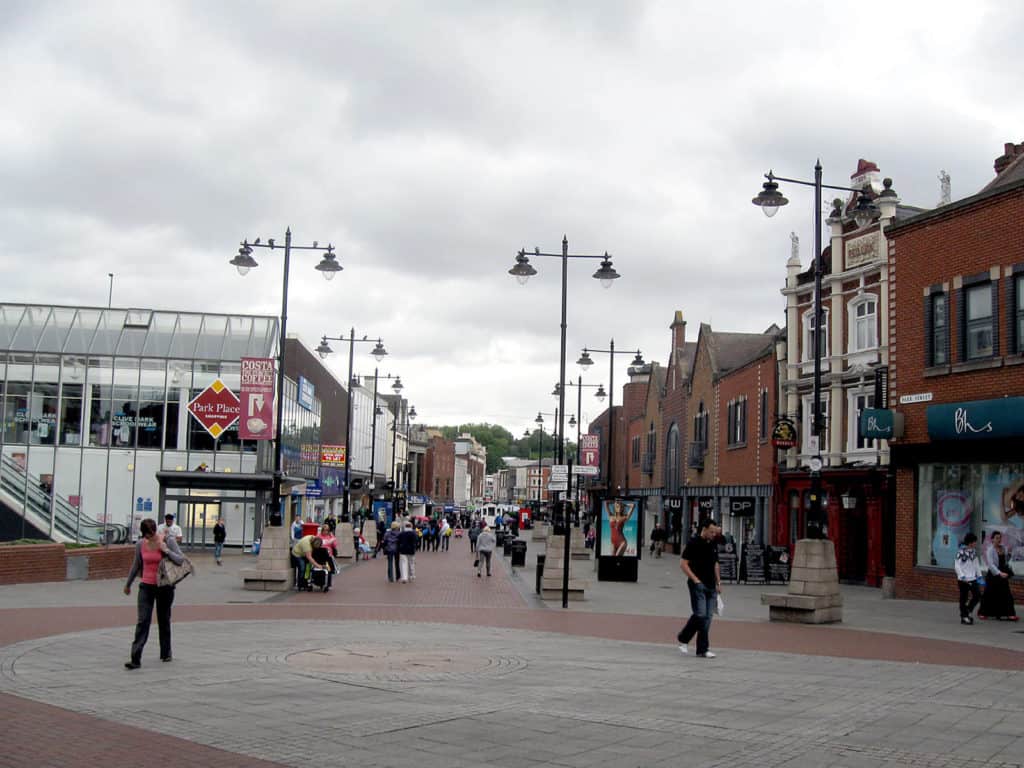
5. Pedestrian footfall
Pedestrian surveys are a type of observation study.
Think about the which day of the week to count pedestrians. Pedestrian numbers are likely to be higher on a Saturday or Sunday then during the week, during school holidays, during dry weather and if there is a popular event happening in the city centre
Time of day is also important. Pedestrian numbers are likely to be higher during “rush hours” (like 8am-9am) or shift changes and during office lunchtime. Around 11am and 2.30pm are often good times to choose.
You need at least 20-25 survey points. Choose survey points across the city centre. If you are working in groups, each group can walk different routes across the city centre.
This is up to you, but make sure that you survey in the same way each time. Think about
How long to count pedestrians for – 2 minutes is enough. If your survey points are close together (perhaps every 100 metres), you might be able to do 3 or 4 pedestrian counts in 10 minutes.
Whether to count people on one side of the road or both sides of the road – if you are working in groups, different members of the group could count different sides of the road, with someone else holding a stopwatch.
Social inequalities
6. Accessibility survey
Construct a survey to help you collect data on how easy it is for people with limited mobility (such as wheelchair users, elderly people and visually impaired people) to move around the built environment.
The example below was designed to be used for 10 sites at regular intervals along a single street. At each sample site, record the condition of the pavement on one side of the street and the condition of the five nearest doorways.
| Sample point | Score | Example: Site 1: Post Office |
|---|---|---|
| Is the pavement wide enough for a wheelchair? | ||
| – the road is pedestrianised | +2 | 2 |
| – Yes | +1 | |
| – No | 0 | |
| How smooth is the ground surface? | ||
| – Very smooth (no broken slabs or drain covers) | +2 | |
| – Some broken slabs or drain covers | 0 | 0 |
| – Rough (e.g. broken slabs, puddles) | -1 | |
| Is there tactile paving? | ||
| -Yes | +1 | |
| – No | 0 | 0 |
| Are the signs easy to read? | ||
| – Yes (low, large symbols) | +1 | 1 |
| – No | 0 | |
| Is the kerb dropped at crossings? | ||
| – Yes | +2 | 2 |
| – No | 0 | |
| How many obstructions are there (e.g. scaffolding, bollards)? | ||
| – Few or none | +1 | 1 |
| – Many | 0 | |
| Are most doorways wide enough for wheelchairs? | ||
| – Yes | +2 | |
| – No | 0 | 0 |
| Do most doors open easily? | ||
| – Yes | +1 | |
| – No | 0 | 0 |
| Do most doorways have hand rails? | ||
| – Yes | +1 | 1 |
| – No | 0 | |
| Are most doors painted in contrasting colours? | ||
| – Yes | +1 | |
| – No | 0 | 0 |
| Can most doorbells be reached easily? | ||
| – Yes | +1 | 1 |
| – No | 0 | |
| TOTAL | 8 |
7. Crime surveys
There are several aspects of crime that you can investigate in the field.
(a) Index of burglaribility
Construct a survey to help you collect data on how susceptible a house of business premises is to be burglary. Here is an example that you may wish to adapt to your study area.
| Feature | Score |
|---|---|
| Burglar alarm | +2 |
| Security lights | +1 |
| Security windows | +1 |
| Neighbourhood Watch | +1 |
| Quiet street | -1 |
| Secluded entrance | -1 |
| Backing onto open space | -1 |
(b) Vandalism survey
Construct a survey to help you collect data on vandalism. Consider
- Graffiti
- Scratched, burnt and smashed glass (e.g. bus shelters)
- Litter and fly-tipping
- Damage to street furniture (like seats)
- Damage to trees and plants
Distribution could be measured on the ACFOR scale: abundant, common, frequent, occasional, rare. Here is an example of a graffiti scale you could adapt.
| Feature | Detail | Score |
|---|---|---|
| Maximum size of words | 0-10cm / 11-25cm / 26-50cm / >50cm | +1 / +2 / +3 / +4 |
| Maximum size of pictures | 0-10cm / 11-25cm / 26-50cm />50cm | +1 /+2 / +3 / +4 |
| Content | If obscene | +5 |
| Method | Ink or pencil / Felt-tip pen / Aerosol / Carved | +1 / +3 / +5 / +10 |
| Visible from | 1-5m / 6-10m / 11-30m / 31-50m / >50m | +1 /+2 / +3 / +4 / +5 |
(c) Mental mapping: fear of crime
The most likely victim of street crime in Britain is a man aged 16-24 (Office for National Statistics). But the fear of crime is different; it is to do with perception. You could investigate this through questionnaires, or by asking people to construct mental maps.
Mental mapping is a technique which allows you to collect a lot of quantitative data on people’s perceptions of space. Mental maps are particularly useful to capturing data on whether people perceive places as threatening, unsafe or otherwise undesirable.
Photocopy a base map of different places in an area, such as 10 contrasting wards in a city. Ask each participant to colour in each place on the following scale. Remind participants that they should be thinking about 24 hours a day and 7 days a week.
This place is always unsafe – colour in RED
This place is sometimes unsafe – colour in ORANGE
I don’t know this place – colour in BLUE
This place is mostly safe – colour in YELLOW
This place is always safe – colour in GREEN
Results can be summarised by scoring red as -2, orange as -1, blue as 0, yellow as 1 and green as 2. Find the mean score for all participants and present the aggregated results as a chloropleth map. You could also put together separate maps showing the results for contrasting groups, such as male and female.
8. Bus Index
A lack of transport can be a major problem for people who do not have access to a car. You can measure this problem by calculating the Bus Coverage Index for each village.
Bus Coverage Index = (journey time from village A to town B in minutes) ÷ (number of buses between village A and town B in both directions per weekday)
The lower the Bus Coverage Index, the greater the accessibility.
| Worked example | |
|---|---|
| Hanwood and Snailbeach are both villages near Shrewsbury. Shrewsbury contains a sixth-form college. How easy is it to get from Hanwood or Snailbeach to the college in Shrewsbury? | |
| Hanwood It takes 19 minutes to travel from Hanwood to Shrewsbury and there are 12 buses each way every day. Bus Coverage Index = 19 ÷ 12 = 1.58 Snailbeach It takes 38 minutes to travel from Snailbeach to Shrewsbury and there are 8 buses each way every day. Bus Coverage Index = 38 ÷ 8 = 4.75 |
This works best where there is only one large town nearby with shops and services. You can use bus timetables in each village to find out the journey time to the nearest town and how many buses there are each day. Alternatively use Traveline
Environmental inequalities
9. Environmental quality assessment
What are the streets like in each area? Construct a survey to measure environmental quality in each area contrasting area. Here is an example of an Environmental Quality Assessment that you could adapt to your city.
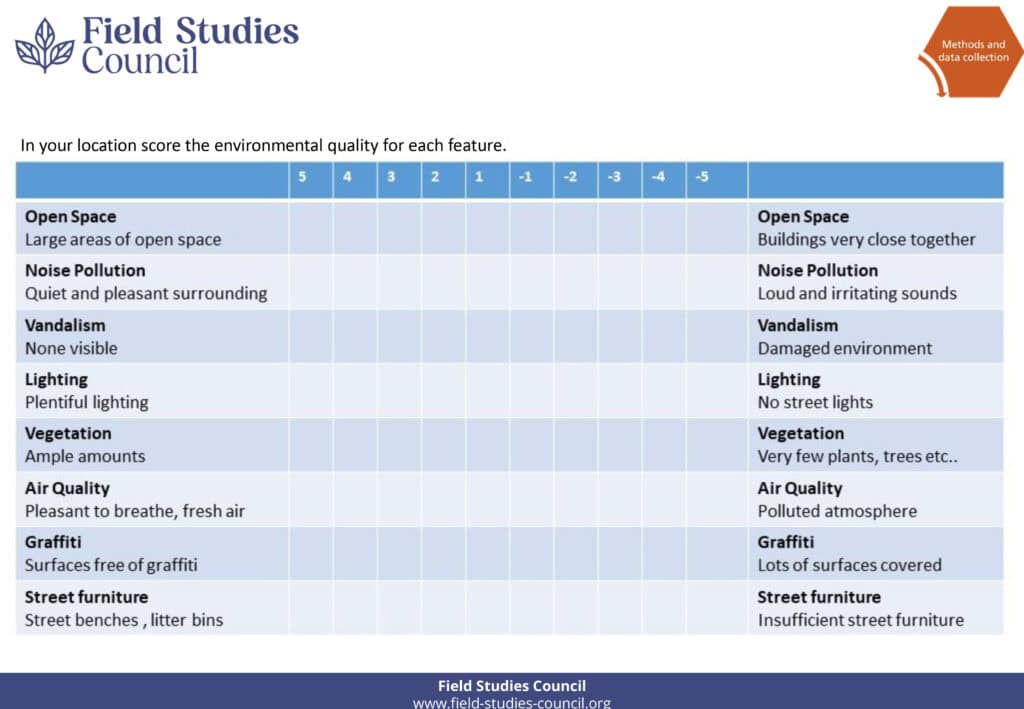
A written description and/or photographs may help you be consistent in giving scores. One way you could do for scoring ‘litter’ this is shown below
- 0 = no litter visible
- + = no more than 10 small items visible, all recent
- ++ = large amount of recent litter items
- +++ = accumulation of large items, some items have clearly be in situ for months
10. Building decay survey
You can also measure the condition of housing. Make sure that you sample houses fairly. You might, for example, choose to sample two streets picked at random, and then sample house numbers 5, 15 and 25 on each street.
| Factor | House condition survey | |||
|---|---|---|---|---|
| None | A little | Some | Lots | |
| Peeling paint | 0 | 1 | 3 | 5 |
| Damage to roof | 0 | 1 | 3 | 5 |
| Damage to walls | 0 | 1 | 3 | 5 |
| Damage to gutters | 0 | 1 | 3 | 5 |
| Broken glass | 0 | 1 | 3 | 5 |
| Visible cracks in walls | 0 | 1 | 3 | 5 |
| Rotting wood | 0 | 1 | 3 | 5 |
Secondary data sources
1. Index of Multiple Deprivation (IMD)
The Index of Multiple Deprivation can be used as secondary data to help you investigate quality of life in urban and rural areas. This map of IMD in Taunton shows that some parts of Taunton are within the 10% most deprived parts of England. Other parts of Taunton are within the 10% least deprived parts of England.
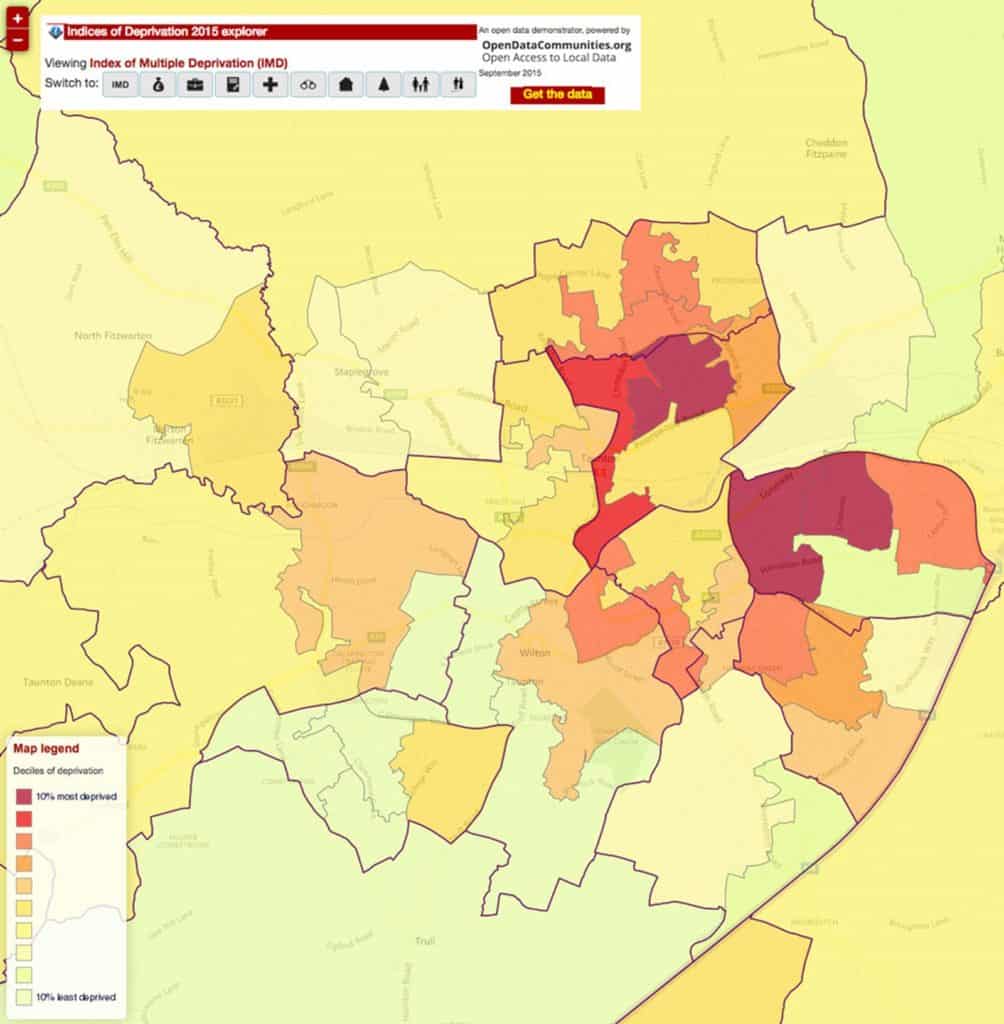
England has been divided into 32,844 small areas called Lower Super Output Areas (LSOAs). THE IMD is calculated by combining scores for 7 different “domains”:
- Income
- Employment
- Health
- Education
- Housing
- Crime
- Living environment
The scoring is weighted so that income and employment contribute more to the overall score than the other “domains”. Each LSOA is given a rank for deprivation.
IMD has been calculated in 2004, 2007, 2010 and 2015, so you could use historic IMD data to track changes in inequality over time.
2. Accessibility by road
From an Ordnance Survey map, make a raw count of the number of A roads, number of B roads and number of other roads linking the village to other places. If, for example, an A road passes through the village, count it as two roads – since it links two sets of places.
Draw a circle with a 0.5km radius around the centre of each village. As each road bisects circle allocate points as follows: A-roads 10 points, B-roads 5 points and other roads 1 point. Sum the points for each village.
A second consideration is the time that it takes to travel along different types of road. It is fair to assume that a journey along a dual carriageway will be faster than a journey of the same length along a winding single-track country lane. There are several route planners available (e.g. AA Route Planner) which will calculate the journey time for you.
3. Crime data
Deprivation data:
4. Health data
Interactive map by Public Health England
5. House prices
6. Education data
7. Jobs data
8. Broadband availability
9. Environment data
What’s in your backyard? (Environment Agency)

Secondary and Further Education Courses
Set your students up for success with our secondary school trips and courses. Offering excellent first hand experiences for your students, all linked to the curriculum.
Group Leader and Teacher Training
Centre-based and digital courses for teachers