Present your findings with a range of quantitative and/or qualitative techniques. Each technique should be accurately drawn and appropriate for the information being presented. Here are some suggestions.
Bar charts
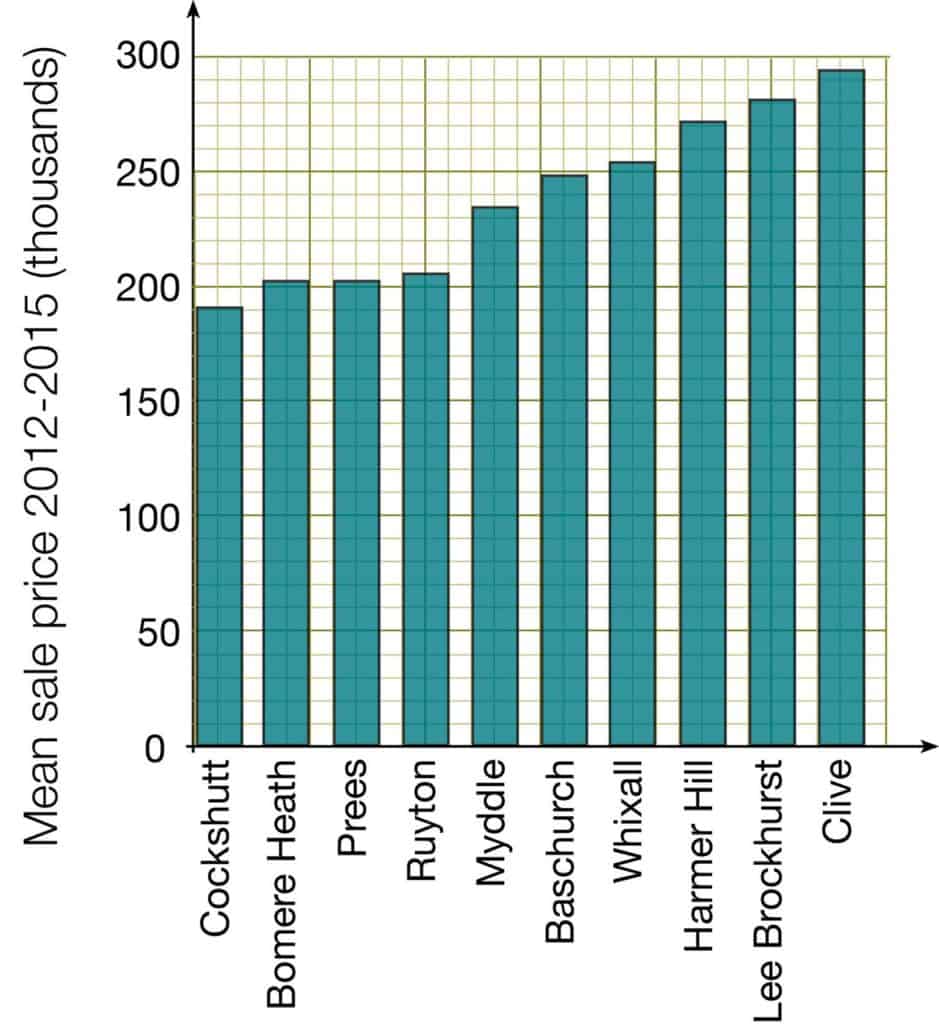
Use a bar chart when you want to compare different places, such as sites. The x-axis has labels. Leave a gap between bars. A bar chart can only be used for discontinuous data.
Here is an example of mean sale price in 10 rural settlements. The data has been obtained from a secondary source.
Divided bar charts
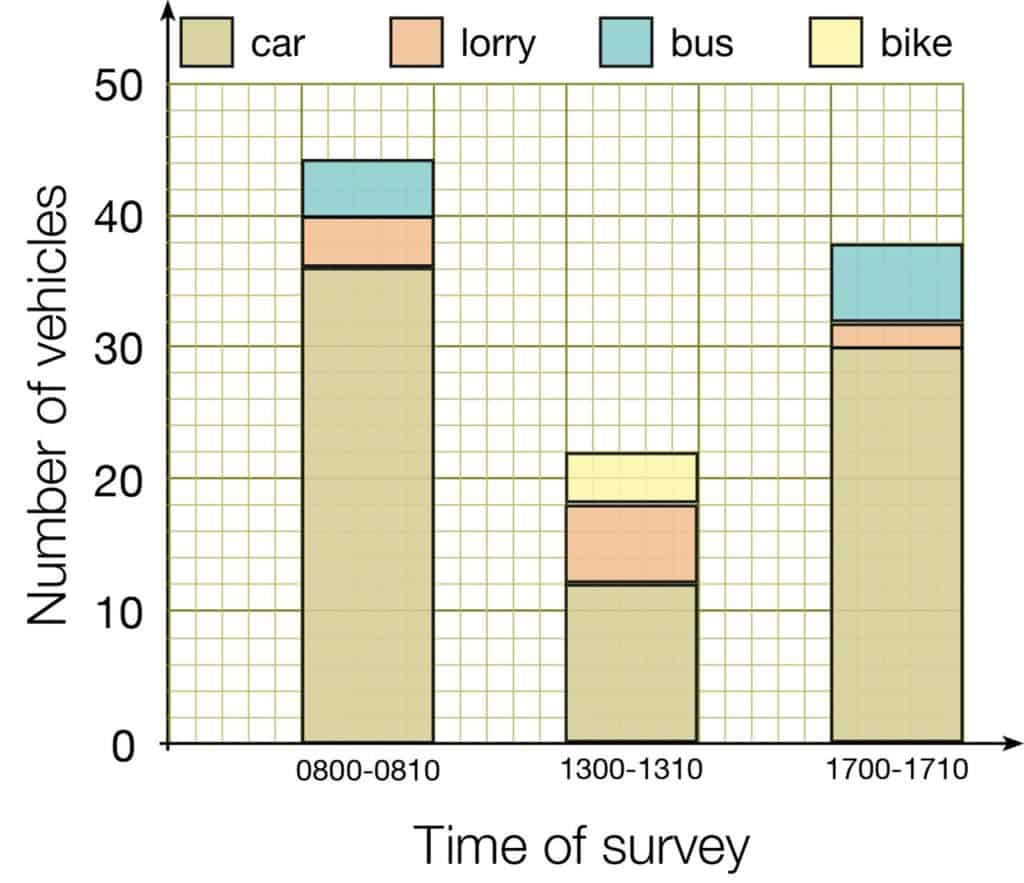
Divided bar charts show the total number of items and how many are in each category. The bars do not have to be the same height. The x-axis has labels. Leave a gap between the bars.
Here a student has carried out a traffic survey at the same site at three different times of day.
Percentage bar charts
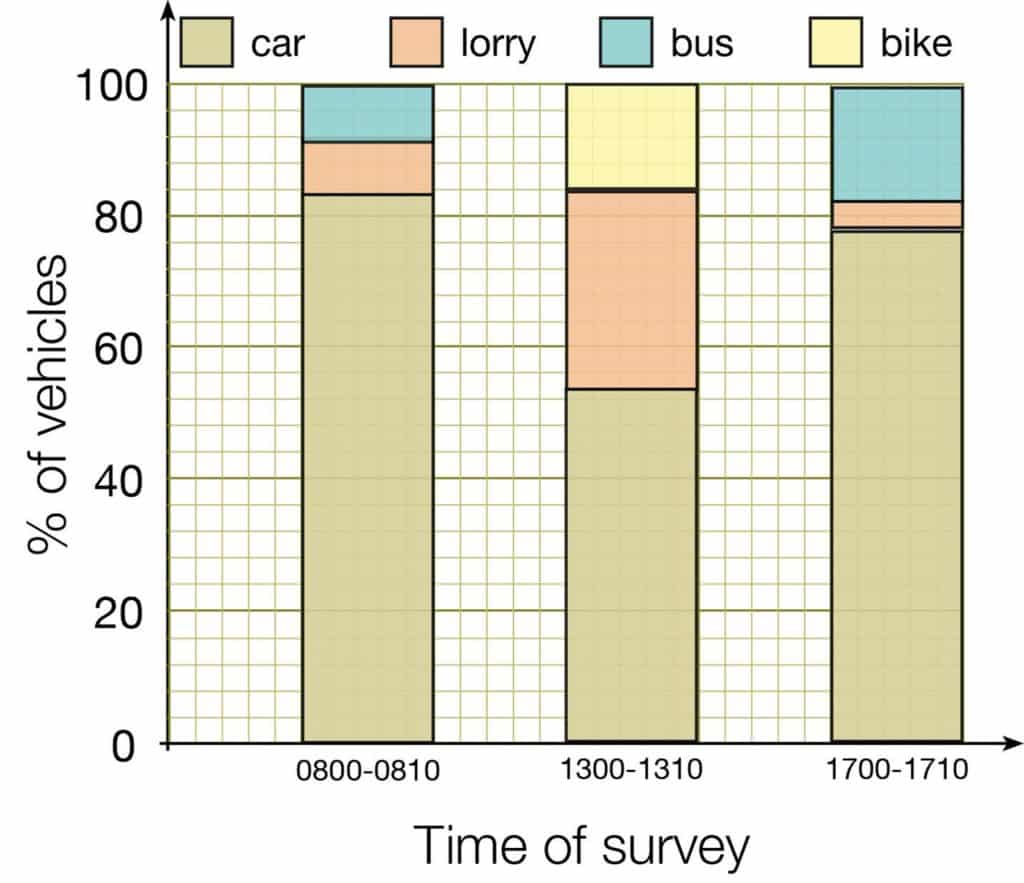
Divided bar charts show the total percentage of the total in each category. Unlike a divided bar charts, the bars are all the same height. The x-axis has labels. Leave a gap between the bars.
Here a student has carried out a traffic survey at the same site at three different times of day. This chart uses the same traffic survey results as the divided bar chart above.
Bi-polar analysis
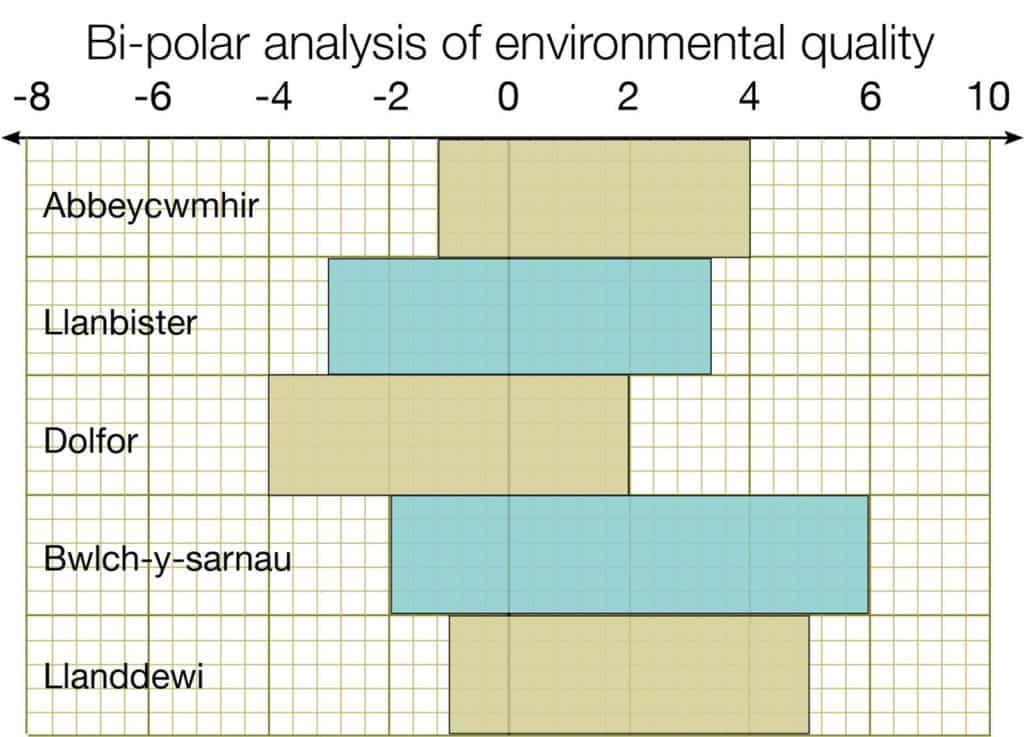
One way of displaying the results of the bi-polar analysis is to draw a bar chart with the bi-polar score on the x-axis and labels on the y-axis.
Find the total of all the negative scores and all the positive scores for each settlement. The graph below shows what this might look like. For example, at Dolfor the total of all negative scores is -4 and the total of all positive scores is +2.
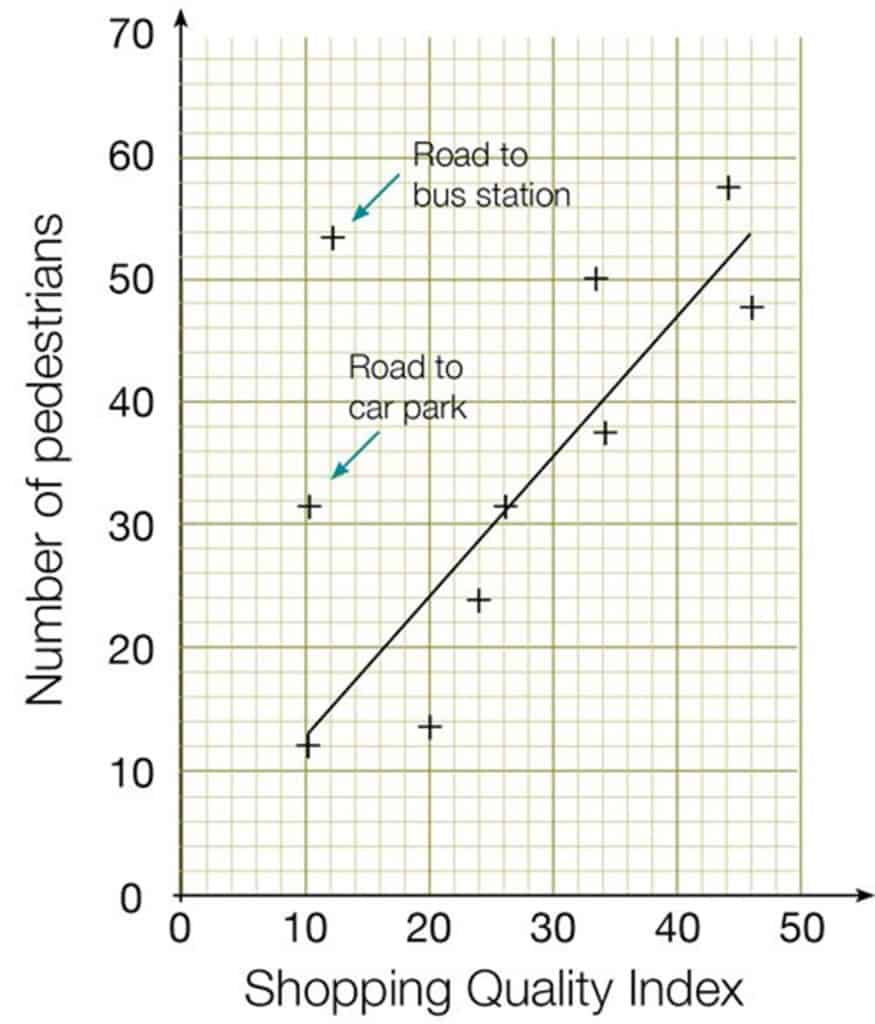
Scattergraphs
Plot a graph with one variable on the x-axis and another on the y-axis. The independent variable goes on the x-axis, and the dependent variable on the y-axis. Here is a scattergraph of shopping quality index plotted against pedestrian footfall for a CBD.
Maps
You can use maps as a background for displaying your results.
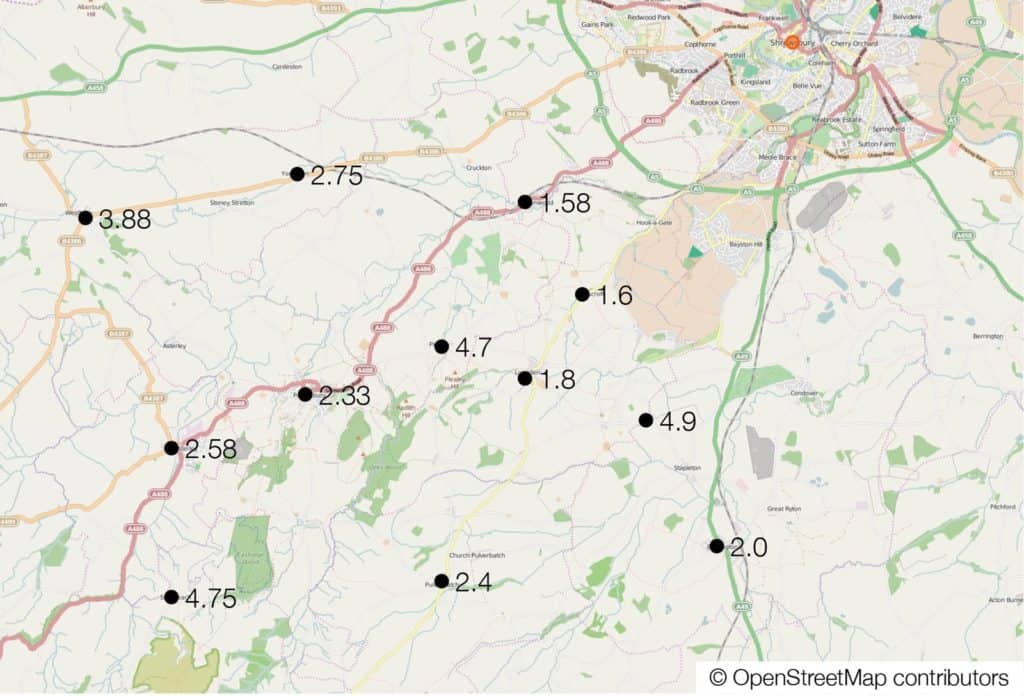
In this example, the Bus Coverage Index for 12 villages has been shown on a map.
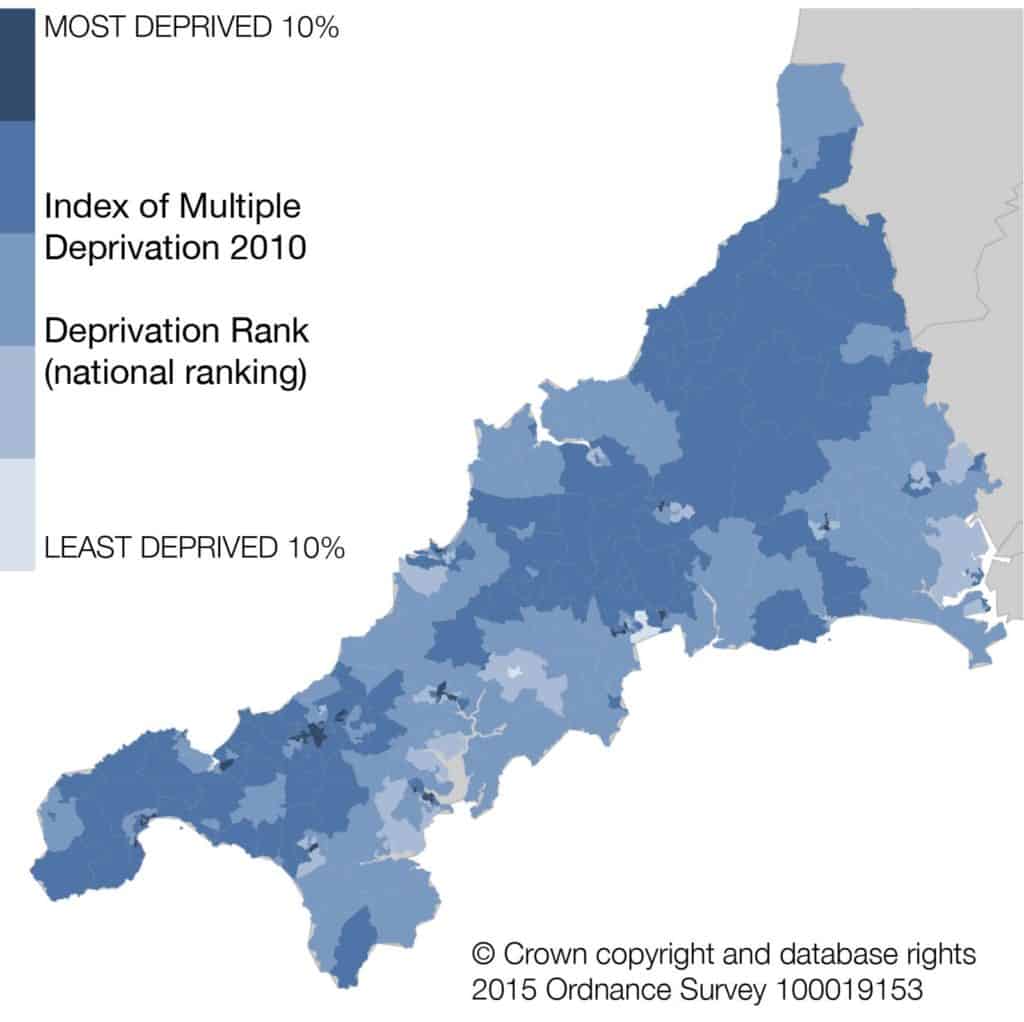
Choropleth maps
Choropleth maps are shaded according to a key.
This example uses secondary data to show deprivation levels in Cornwall (IMD 2010).
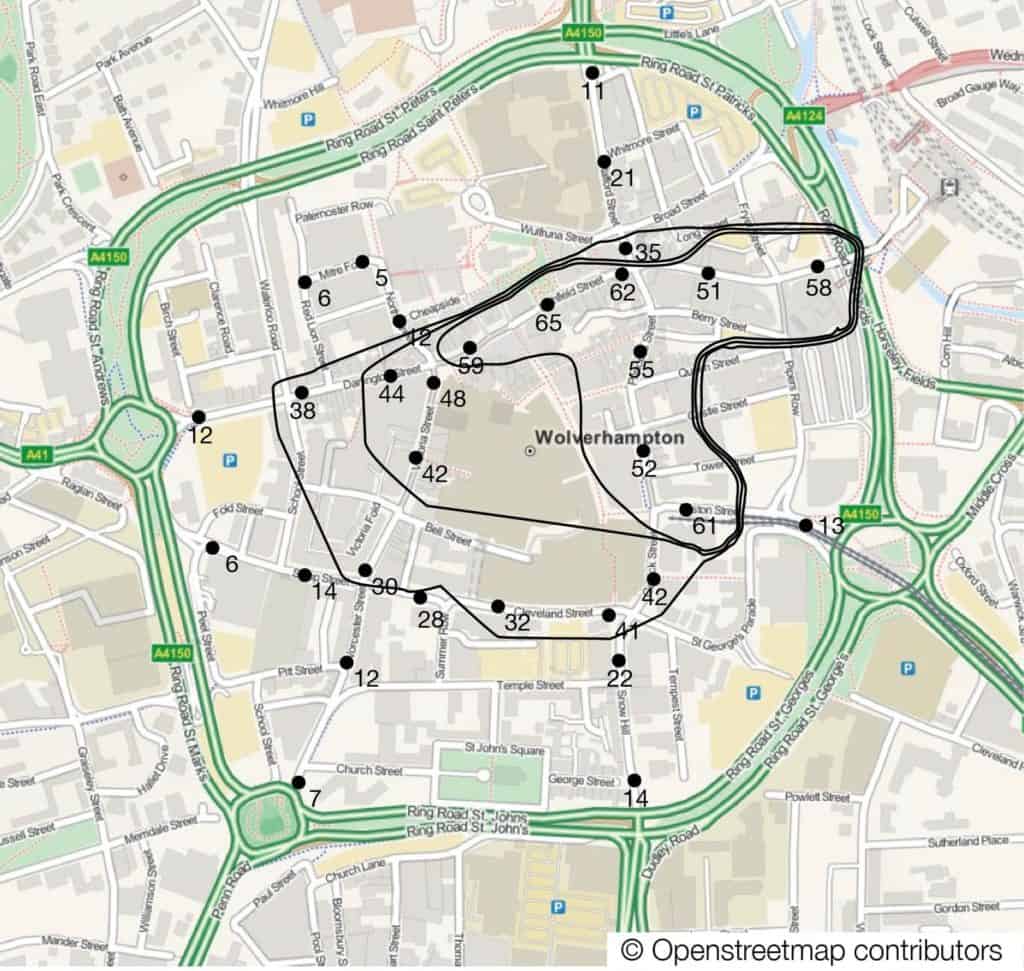
Isoline maps
You can use maps as a background for displaying your results.
Isoline maps show lines of equal value. In this example, pedestrian counts have been taken across a CBD. The map on the left shows raw results. the map on the right shows isoline maps for 50, 40 and 30.
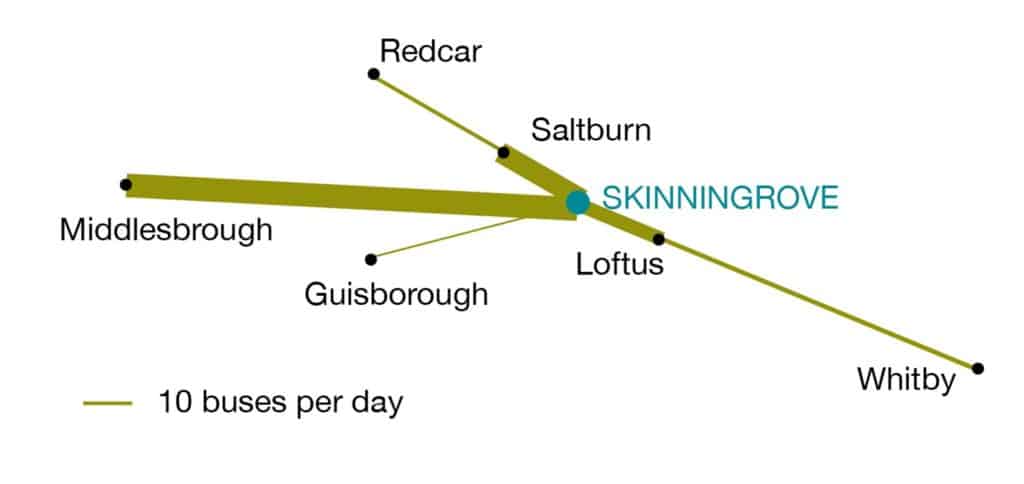
Flow maps
Using secondary data, this shows the direction and volume of buses per day to the village of Skinningrove.
Annotated photographs
It is not enough just to write labels on the photo (e.g. “farm” or “looks expensive”. Instead try to write a short explanation of what you can see, using geographical words where you can. These are examples of well annotated photos.
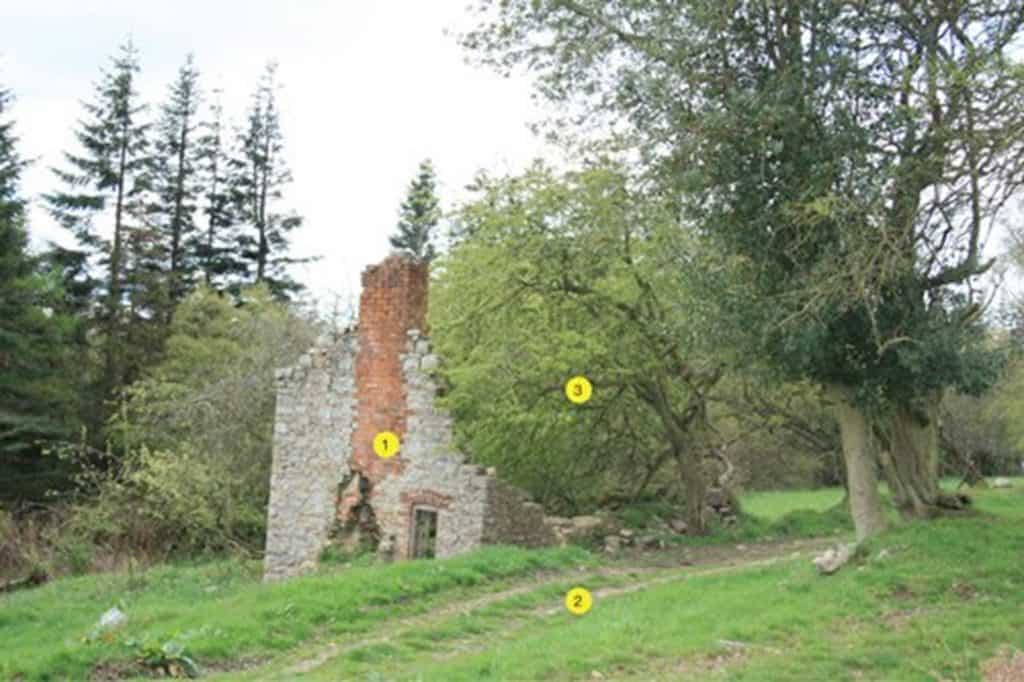
- Roof, some walls and windows missing from house. The house has been abandoned since local mines closed.
- No tarmac road, only a rough track, so the old house is not easily accessible by car.
- Growth of trees inside the house shows that it has been decades since the house was abandoned.
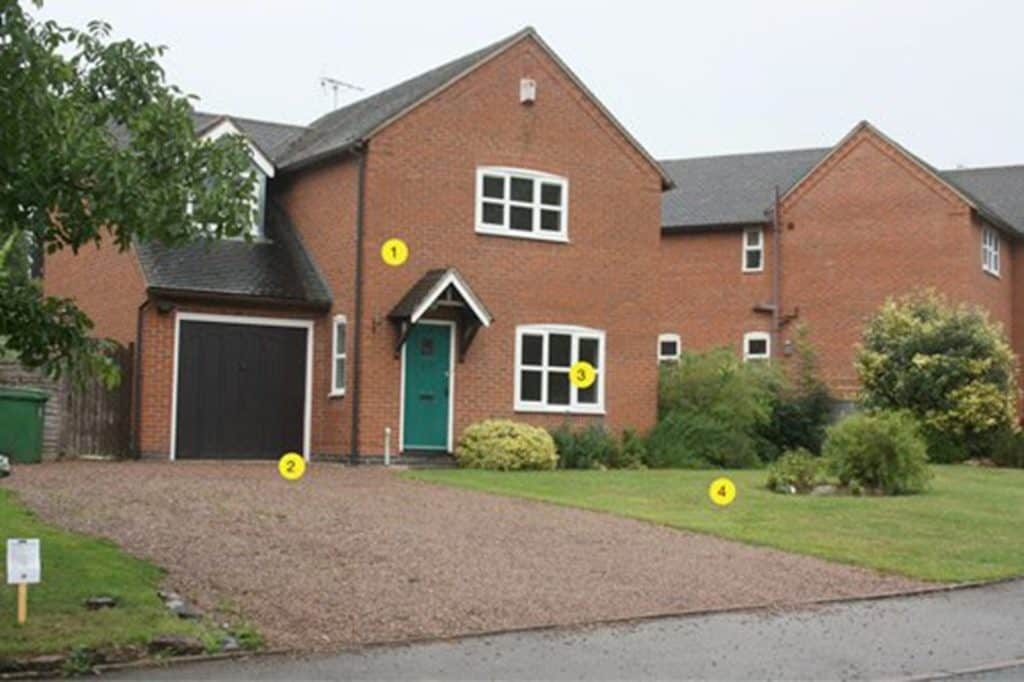
- Traditional shape of windows and roof over porch, but with a built-in garage. This suggests a house built since 1980.
- Large drive and built-in garage suggests the house was designed for a family owning more than one car. The owners will probably use cars to commute to work in the nearest town, instead of having traditional rural jobs like farmworkers.
- Double-glazed windows and central heating suggest no housing deprivation.
- Front garden with lawn and shrubs is not much work to keep tidy. This suggests that the house owned by people without much free time outside of work, possibly commuters.

Secondary and Further Education Courses
Set your students up for success with our secondary school trips and courses. Offering excellent first hand experiences for your students, all linked to the curriculum.
Group Leader and Teacher Training
Centre-based and digital courses for teachers