Sampling
Sampling is the process of collecting data from some sites or people in order to obtain a perspective on the population. It is applicable to both qualitative and quantitative methods. You should explain how representative a sample is. It affects how the findings can be applied.
Sample
A limited number of things, such as a group of 100 people or 50 pebbles on a beach.
Population
The total number of things, such as all residents of a city or all pebbles on a beach.
Representative
How closely the relevant characteristics of the sample match the characteristics of the population.
Bias
An inclination or prejudice towards or against a specific finding or outcome.
Probability sampling
The aim of probability sampling is to select a sample which is representative of the population. There are three techniques:
Random sampling
This is where each member of the population is equally likely to be included.
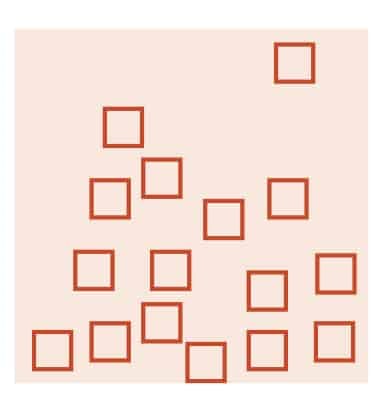
For taking random samples of an area, use a random number table to select numbers. Use pairs of numbers as x and y co-ordinates. You could use a metre rule interval markings (e.g. to take pebble samples on a beach) or grid references (e.g. to find random samples in a city).
Stratified sampling
This is where a proportionate number of observations is taken from each part of the population.
For example, an urban ward may contain 8 deprived super output areas and 2 undeprived super output areas. A random sample may by chance miss all the undeprived areas. By contrast, with a stratified sample, you can make sure that 80% of your samples are taken in the deprived areas and 20% in the undeprived areas.
Systematic sampling
This is where observations are taken at regular intervals.
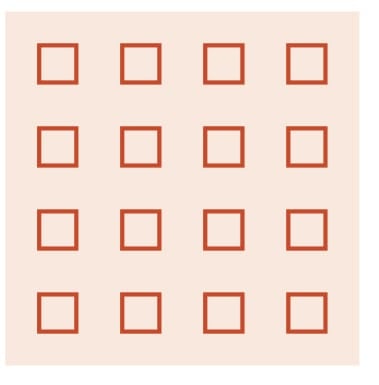
For example, every 10 metres along a line running from seashore inland across a beach, or recording the age of every fifth person in a shopping centre.
Sampling over space
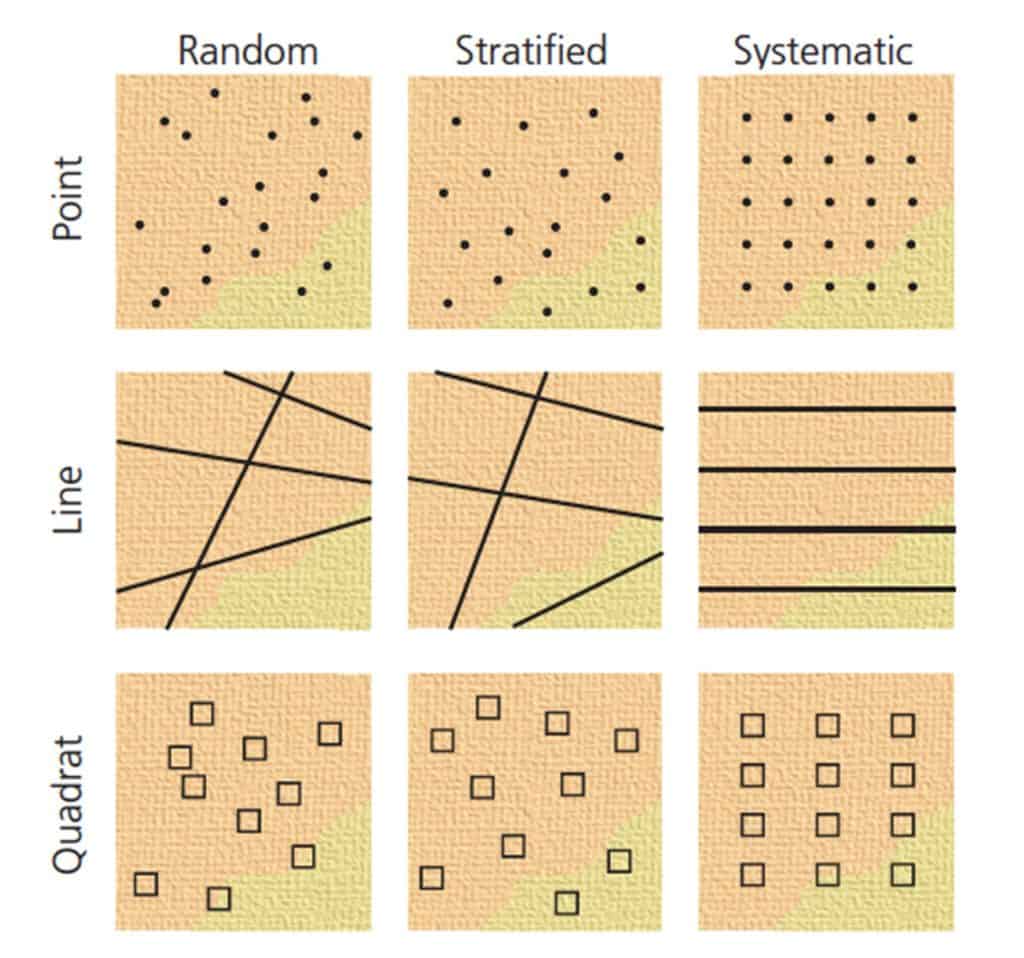
- Point sampling. Take observations at individual points, like separate houses on a street
- Line sampling. Take observations along a line, like up a beach from sea shore to base of the cliffs
- Quadrat sampling. Make a square on the ground or on a map. Take observations within that square. For example, place a quadrat on the beach and measure pebble shape and size within that area.
Collecting quantitative data
Variables
The things that you are interested in measuring are called variables. There are two types:
- Independent variable is not affected by other things. It is independent of other variables.
- Dependent variable is affected by other things. It is dependent on other variables.
An independent variable causes a change in a dependent variable. A dependent variable cannot cause a change in an independent variable.
Measurement scales for variables
There are four measurement scales for variables:
- Nominal: variables that are not numerical,
e.g. categories like gender and ethnicity. - Ordinal: variables where order has meaning, but the difference between values is not important,
e.g. ranks like 1st, 2nd and 3rd. - Interval: variables where the difference between values is important,
e.g. actual numbers like the temperature in °C. - Ratio: Iinterval data with a natural (absolute) zero point.
Time in seconds has a ratio scale, but temperature in °C does not (since 0°C does not mean no heat).
Collecting qualitative data
Observation
Observational data is commonly recorded as notes, sketches or audio/video recordings. There are three types of observation method:
- Naturalistic Observing people in their natural environment.
- Participant Observing behaviour as a participant in a group.
- Controlled Observing behaviour(s) under certain conditions and/or time parameters.
Consider validity (does your presence influence behaviour?) and ethics (do you have consent?).
Questioning
Questioning (used in questionnaires and interviews) can be quantitative or qualitative.
Closed questions. Answers are limited to single words, numbers or listed options. The collated data is quantitative.
Example: ‘Do you feel safe in High Street at 11pm?‘ Answers: Yes / No / Don’t know
Statements. There are two ways of presenting statements:
(a) Semantic differential scale – use 8-12 pairs of words and a scale from negative to positive.
Example:
| Threatening | -2 | -1 | 0 | +1 | +2 | Friendly |
| Dangerous | -2 | -1 | 0 | +1 | +2 | Safe |
| Isolated | -2 | -1 | 0 | +1 | +2 | Surveilled |
(b) Likert scale – ask participants whether they agree or disagree with a series of statements. Use 8-12 statements with a balance of positive and negative.
Example statement: ‘High Street is safe at 11pm.‘ Answers: Strongly agree / Agree / Don’t know / Disagree / Strongly disagree
Open questions. Answers are detailed text. The data is qualitative. If the results are categorised, the number of responses per category (i.e. frequencies) can be treated as quantitative data. Example: ‘Is High Street safe?‘
Questionnaires can cover a large sample population. They are useful for gathering data on people’s perceptions and experiences of place.
Interviews often involve a smaller sample than questionnaires. They can gather more in-depth data. Focus groups are a type of interview involving multiple interviewees in a focused discussion.
Non-probability sampling
For some qualitative methods like interviews, it may be impractical to select a representative sample. In non-probability sampling, the sample is selected through the subjective judgment of the reseacher. There are three techniques:
Convenience sampling
Select people who are easy to reach, e.g. giving out a questionnaire to the first 100 people you see in the High Street on a particular morning.
Snowball sampling
Select at least two people. Ask each person to help you find more interviewees. Continue finding new people until you have achieved your desired sample size.
Quota sampling
Deliberately select a proportionate number of people from each part of the population.

Secondary and Further Education Courses
Set your students up for success with our secondary school trips and courses. Offering excellent first hand experiences for your students, all linked to the curriculum.
Group Leader and Teacher Training
Centre-based and digital courses for teachers