All Geography starts with someone going into the field to find out what’s there. This section will help you to gather the primary data (data you collect yourself) and secondary data (data collected by someone else) that will support your analysis and conclusions.
| Type of data | Primary data collection technique | Secondary data collection source |
|---|---|---|
| Carbon cycle in woodland | Estimating tree carbon content Estimating tree density through plotless sampling | Maps and aerial photographs Forest Research data |
| Carbon cycle in peatland | Measuring peat depth Measuring soil carbon content | Maps and aerial photographs |
| Links between carbon cycle and water cycle | Analysis of stream water | Earlier studies |
Carbon cycle in woodlands
1. Estimating tree carbon content
For each tree, you need to measure the circumference of the trunk and the height of the tree. You can use these fieldwork results to calculate the biomass of the tree and its carbon content. This is explained more fully in the Data Analysis section.
(a) Measuring the circumference of the tree
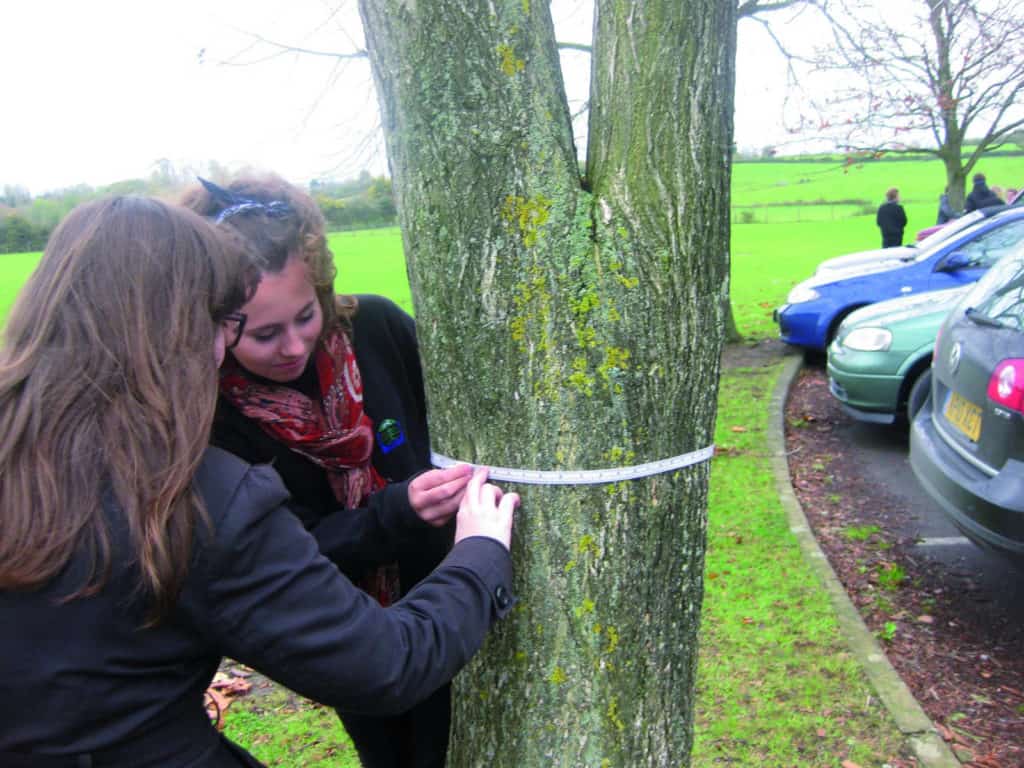
Use a tape measure to measure the circumference of the tree at 1.5m from the base.
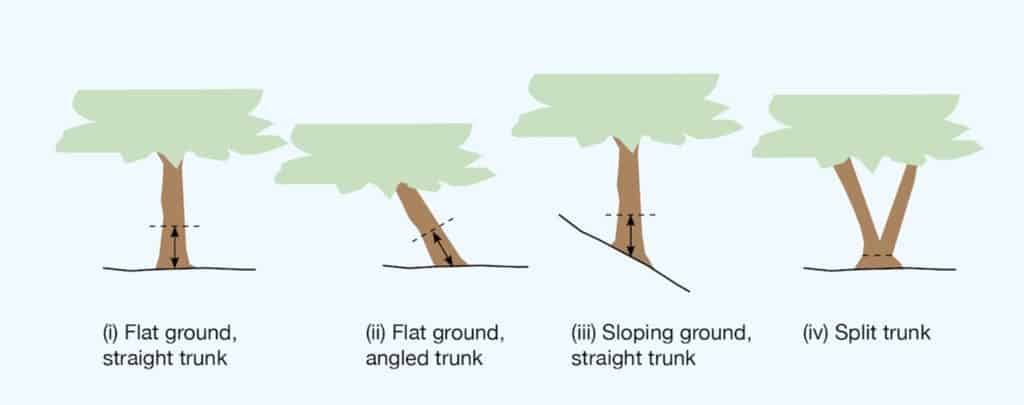
If the tree trunk grows out of the ground at an angle, measure the circumference at right angles to the trunk at 1.5m along the centre of the trunk axis, so the height is the average of the shortest and the longest sides.
If the ground is sloping but the tree trunk is straight, measure the circumference at 1.5m along the centre of the trunk axis, so the height is the average of the shortest and the longest sides.
If the trunk splits less than 1.5m from the ground, measure the smallest circumference below the lowest branch.
(b) Measuring the height of the tree
You need a tape measure and clinometer for this method. Start next to the tree trunk and walk away until you can see the top of the tree. Use a clinometer to measure the angle of elevation from your eye to the top of the tree. use a tape measure to record the distance along the ground from the tree trunk to where you took the clinometer reading. Also record your own height. Make sure that all distance measurements are recorded in metres.
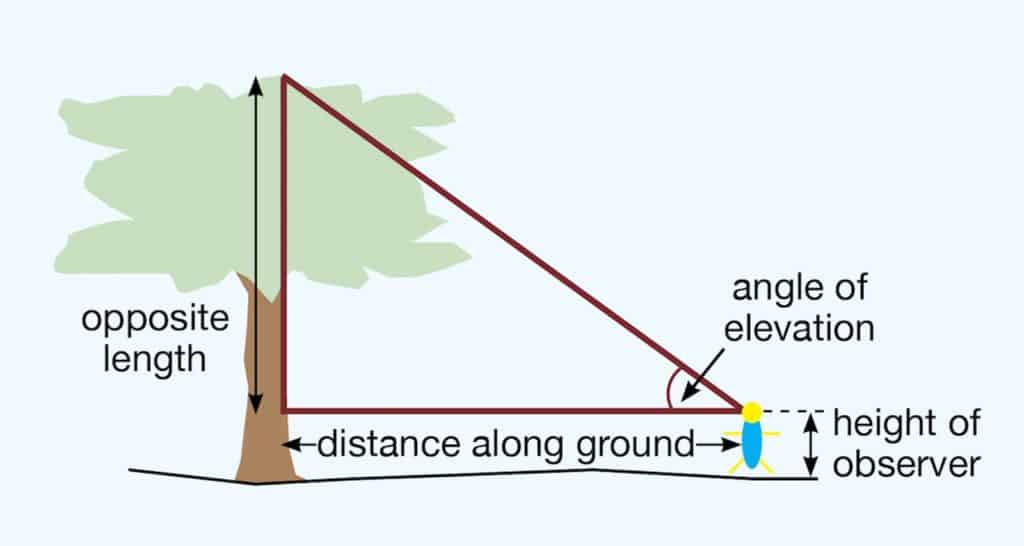
You can calculate the height of the tree as follows
\(\mathsf{Tree\;height = distance\;along\;ground\;\times\; tan (angle\;of\;elevation)\;+\;height\;of\;observer}\)
As a quick rule of thumb, remember that tan 45° = 1. If you can walk far enough away from the tree that the angle of elevation from your eye to the top of the tree is 45°, the height of the tree will be equal to the distance along the ground from the tree trunk to where you took the clinometer reading plus your own height.
2. Estimating tree density: plotless sampling
How many trees are there in an area of woodland? If they are planted in regular rows in a plantation it might be possible to count them, but for a natural woodland where the trees are randomly distributed this will not work. Quadrats cannot be used. Instead you will need to use plotless sampling.
Use random numbers to generate x and y co-ordinates.
(a) Nearest individual method
Measure the distance from the x,y co-ordinates to the nearest tree.
Calculate the mean distance.
\(\mathsf{Density\;of\;trees} = \frac{1}{(2 \bar D)^2}\)
where \(\bar D\) is the mean distance.
(b) Point-centred quarter method
Measure the distance from the x,y co-ordinates to the nearest individuals in each quadrant.
Calculate the mean distance
\(\mathsf{Density\;of\;trees} = \frac{1}{(\bar D)^2}\)
where \(\bar D\) is the mean distance.
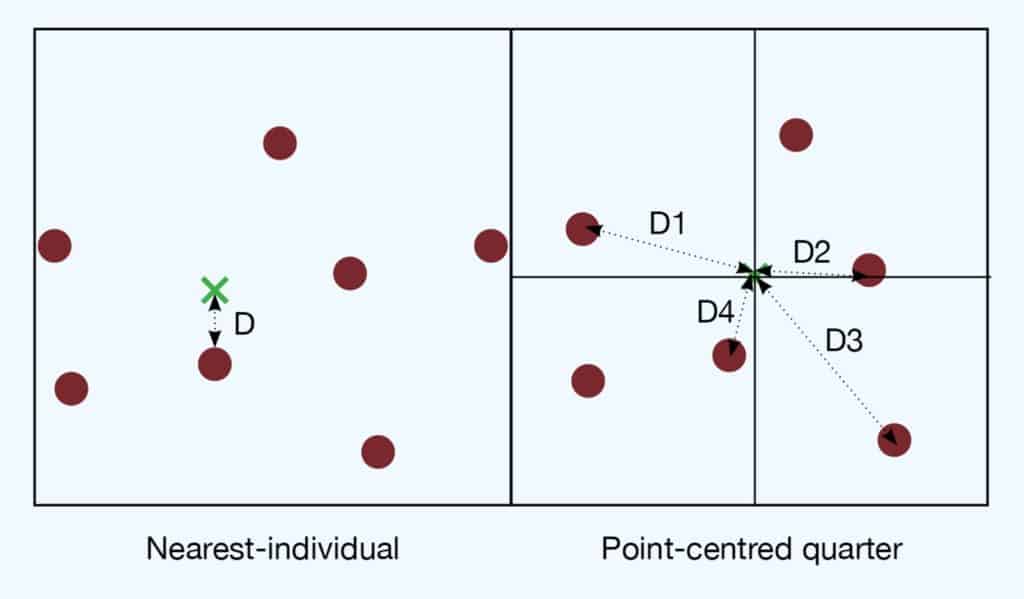
Repeat the method until you have sampled enough trees (50 is a minimum).
Carbon cycle in peatland
3. Measuring peat depth
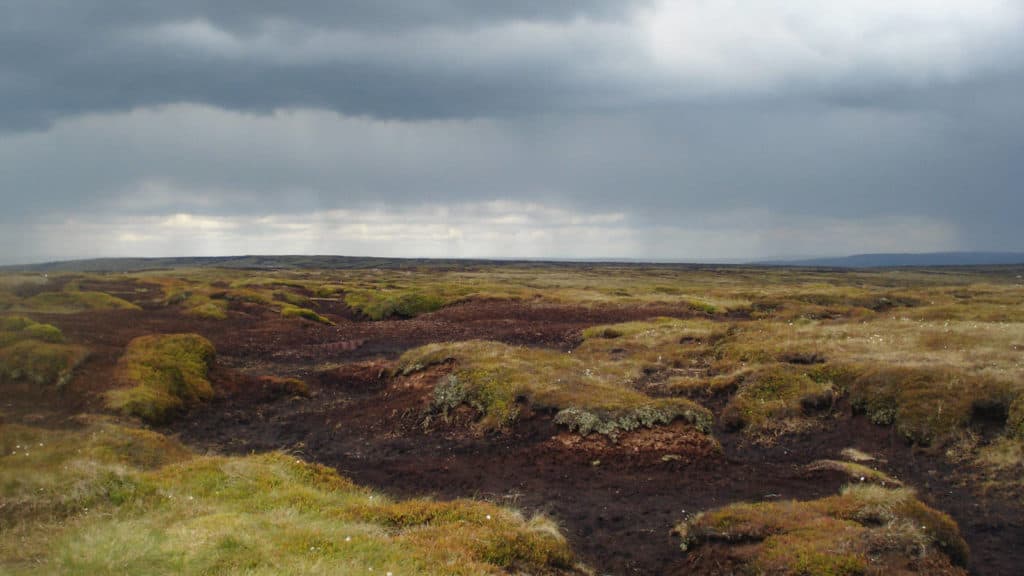
Peat depth is measured by pushing a narrow rod into the ground. Specialist peat probes are available commercially, or you can make your own. The depth to which the rod sinks indicates the local peat depth.
Choose a location which is representative of the surrounding area. Vegetation can raise the ground surface above the actual level of the peat. Make sure that you take enough depth readings.
4. Measuring soil carbon content
Soil carbon content can be measured by taking soil samples, drying them in an oven, reweighing, then burning off the organic content in a soil furnace.
Take a sample of soil from the study area. Find the mass of the fresh soil sample. Dry it thoroughly in an oven, taking care not to put the temperature so high that organic matter is burnt (aim for 105°C if possible). You can tell when the soil is completely dry by weighing it, returning it to the oven for 10 minutes and weighing it again, then repeating until there is no change. Using a pestle and mortar, crush the soil until it is a powder.
Place approx 5g of dried soil from each sample into a crucible. Heat in a muffle furnace for 4 hours. Calculate the difference between mass before burning and mass after burning. This difference is the organic content. Carbon content can be estimated as making up 50% of the organic content.
Links between carbon cycle and water cycle
5. Analysis of stream water
Streams that flow from peatland can be sampled for carbon content.
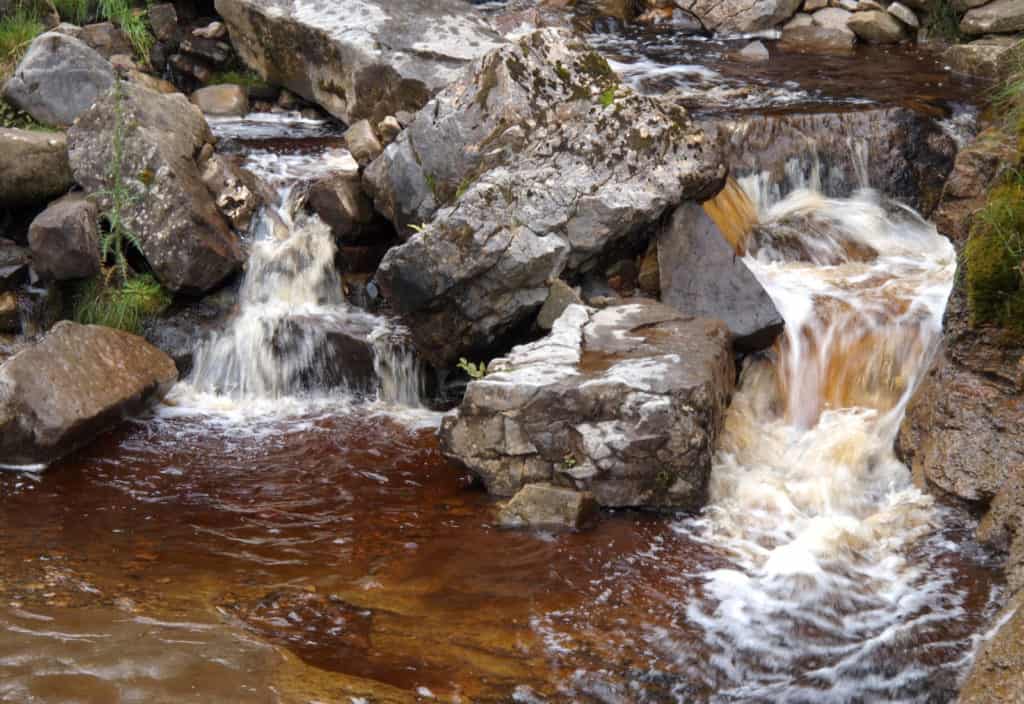
The simplest way to do this is to make a visual assessment of the colour of the water in the field, using a Secchi disc or a turbidity tube. You could make the assumption that the more turbid the water, the higher the carbon content (not always true!).
Or you can take water samples (a 50ml plastic bottle is useful) for analysis in the lab.
The first stage of lab analysis is to test for solid organic sediments. Pass the water sample through filter paper, making sure that you keep the water for the second stage.
Find the mass of sediment that has been filtered out of the water. Place the sediment in a crucible, and heat it in a muffle furnace. Calculate the difference between mass before burning and mass after burning. This difference is the organic content. Carbon content can be estimated as making up 50% of the organic content.
The second stage is to pass the stream water through a colorimeter, which measures the absorbance of different wavelengths of light by the solution.

Secondary and Further Education Courses
Set your students up for success with our secondary school trips and courses. Offering excellent first hand experiences for your students, all linked to the curriculum.
Group Leader and Teacher Training
Centre-based and digital courses for teachers