All Geography starts with someone going into the field to find out what’s there. This section will help you to gather the primary data (data you collect yourself) and secondary data (data collected by someone else) that will support your analysis and conclusions.
| Type of data | Primary data collection technique | Secondary data collection source |
| Precipitation | Weather data | |
| Interception | Interception measurements Stemflow measurements | Weather data Drainage basin characteristics |
| Evaporation | Evaporation pans Potometers | Weather data |
| Soil water | Infiltration rings Estimating field capacity | Weather data Drainage basin characteristics |
| Runoff | Measuring overland flow Measuring throughflow River velocity measurements using a hydro-prop River velocity measurements using a float Measuring channel geometry Calculating discharge | Weather data Runoff data Drainage basin characteristics |
| Modelling the water cycle | Storm simulations | Weather data Runoff data |
Interception
1. Interception measurements
Interception is most easily measured by comparing rainfall underneath vegetation cover (like a woodland canopy) with rainfall where there in no vegatation cover. Place several identical rain gauges in the contrasting areas – don’t just use one rain gauge per area.
You can construct a simple rain gauge from an empty plastic bottle (2 litre size works well). Remove the lid, then cut off the top third of the bottle. Invert this top section into the bottom part. Dig a hole and bury the rain gauge so that about 5cm is sticking out of the ground.
Leave the rain gauge in place for a few days when rain is forecast. Measure the amount of rain collected in each gauge at the same time each day. You could either measure the depth of water in the gauge, or pour the water into a measuring cyclinder to measure the volume.
Alternatively you can compare interception beneath and beyond an individual tree during a single rainstorm by placing several rain gauges at increasing distance from the tree trunk. Measure the depth of water in each gauge every 15 minutes during and for some time after the rainstorm. Stemflow and drip will continue after the rain has finished. Interception by buildings can be assessed by measuring the volume of water discharged by all external guttering and drainage pipes.
You may wish to use interception measurements for one tree to calculate the interception caused by an area of woodland. The simplest way to do this would be to estimate the number of trees in the woodland, and multiply accordingly. Or you could measure the size of the tree canopy, and then multiply up to the size of the woodland.
2. Stemflow measurements
Stemflow is most easily measured for a single tree. Choose a tree with a single large trunk (at least 50cm trunk circumfrence at shoulder height). Wrap split plastic tubing to encircle the tree trunk. 25mm diameter PVC tube is suitable, cut in half lengthways.
Use a wire brush to remove moss from the trunk before installing the tube, so that moss does not fall into and block the tube later.
If you are comparing several trees, position the tubing at a consistent height off the ground. Starting at shoulder height and wrapping at least twice around the trunk is practical, as you will be able to install tubing without needing a ladder.
Use silicon sealant to make a seamless seal between the trunk and the gutter. Direct the base of the tubing into a collecting vessel, such as a large sealed bucket.
Leave the tubing in place for a few days when rain is forecast. Measure the amount of rain collected in each collecting vessel at the same time each day. You could either measure the depth of water in the gauge, or pour the water into a measuring cyclinder to measure the volume.
Evaporation
3. Evaporation pans
Evaporation pans are simply open trays of water. Assuming no rainfall, any change in water level in the pan over time will have been caused by evaporation. Use several evaporation pans of consistent size, being careful to start with the same volume of water in each. If rainfall occurs, you will need to take the water input into account. Also consider water loss from the edge of the pan caused by splashing raindrops.
4. Potometers
A potometer can be used to measure the rate of transpiration by plants. This is a lab investigation, and you can find out more information at the SAPS website
If you are investigating transpiration over a particular area of vegetation, take samples of leaf shoots from the area to test with the potometer.
Soil water
5. Infiltration rings
You will need
- container of water (keep this constant between experiments – 4 litres is enough)
- 30 cm ruler
- metal / plastic tube (to be the ‘infitration tube’)
- stopwatch
- block of wood
Bang the infiltration tube into the ground until it forms a seal (using the wood and mallet to bang it in evenly and avoid affecting the results by stamping on the area of land being tested).
One person fills the infiltration tube to a standardised level (e.g. 15cm). The other starts the stopwatch, and then record the water level every 30 seconds. To maintain water pressure, person 1 should top up the infiltration tube if their water level falls below a certain point (e.g. 10cm). Person 2 should make a note of when this is done, so that it can be taken it into account when they are calculating their infiltration rate.
6. Estimating field capacity
It is possible to make estimates of field capacity by taking soil samples and running an experiment. You will need to repeat the experiment with multiple samples from each part of the drainage basin.
Take a sample of soil from the drainage basin. Find the mass of the fresh soil sample. Dry it thoroughly in an oven, taking care not to put the temperature so high that organic matter is burnt (aim for 105°C if possible). You can tell when the soil is completely dry by weighing it, returning it to the oven for 10 minutes and weighing it again, then repeating until there is no change.
Now find the mass of the dry soil.
Take a measured volume of water and pass it through the dry soil. Reweigh the soil, then deduct the dry mass. The difference between the dry mass and the rewetted mass is water that has been retained. Calculate the mass of retained water as a percentage of dry mass. This provides an estimate of perecentage field capacity, and it can be compared for contrasting areas of a drainage basin.
Runoff
7. Measuring overland flow
Overland flow can be assessed using a length of plastic guttering. Choose a 50cm or 1m long length, with both ends closed. Bury the guttering just in the soil so that the upper edge is parallel with the soil surface. Cover the open top of the gutter with a plastic cover to keep out the rain.
The guttering can be kept in place for several days, ideally during several periods of rain, with regular measurements of the volume of water collected.
8. Measuring throughflow
Throughflow can also be assessed using a length of plastic guttering. Choose a 50cm or 1m long length, with both ends closed. Dig a pit in the soil, to whatever depth you would like to investigate, and place the plastic guttering at the base of the pit.
It is even possible to dig a series of steps at different depths, and use a length of guttering at each depth to measure throughflow at different depths within the soil. An interesting investigation would be to compare throughflow at different depths of moorland soils (known as podsols) where there is a layer of humus on the surface, then a grey and sandy upper layer, and finally a clay-rich yellow and blue subsoil, possibly with a thin impermeable layer (an iron pan) present.
Cover the open top of the soil pit with a plastic cover to keep out the rain and any overland flow.
The guttering can be kept in place for several days, ideally during several periods of rain, with regular measurements of the volume of water collected.
9. River velocity measurements using a hydro-prop
River discharge is a flow in the hydrological cycle. It is measured as the volume of water passing a particular point during a particular time period, such as cubic metres of water per second. Velocity is the speed that the water is moving.
A flow-meter is a digital meter that measures the velocity of the water directly. Hold the meter above the water. Put the probe in the water. The meter will give you a reading of the velocity of the water in metres per second.
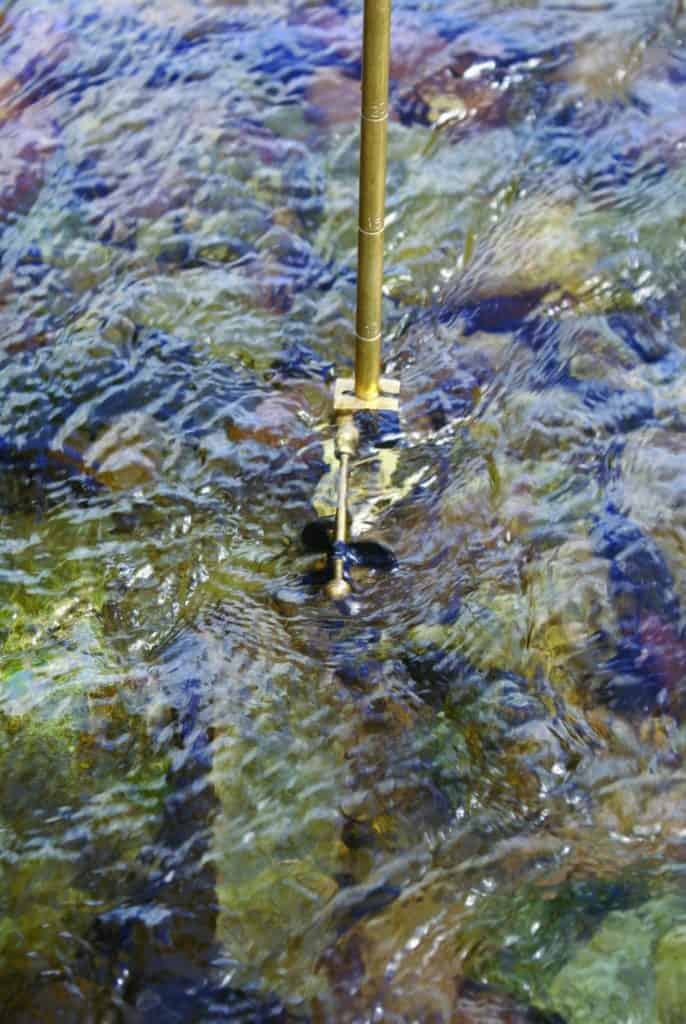
A hydro-prop is a metal pole with a propeller at one end. You hold the hydro-prop with the propeller facing upstream. Use a stopwatch (or timer on a phone) to measure how long it takes for the propellor to travel the distance of the rod. A formula is used to convert this time into velocity, e.g.
\(\mathsf{velocity = 0.0277 + (3.281 ÷ time)}\) (Time measured in seconds)
3.281 is the length in cm of the distance travelled by the fan along the impellor, when the rotation is considered. Each impellor is hand made to the same specification.
0.0277 is an added error supplied by the manufacturer to account for the friction between the fan and the brass impellor.
Take repeat velocity readings at each site, such as left-hand side, centre and right-hand side of the channel. Calculate the mean velocity.
Try to hold the flow-meter or hydro-prop in the same way each time that you take a measurement.
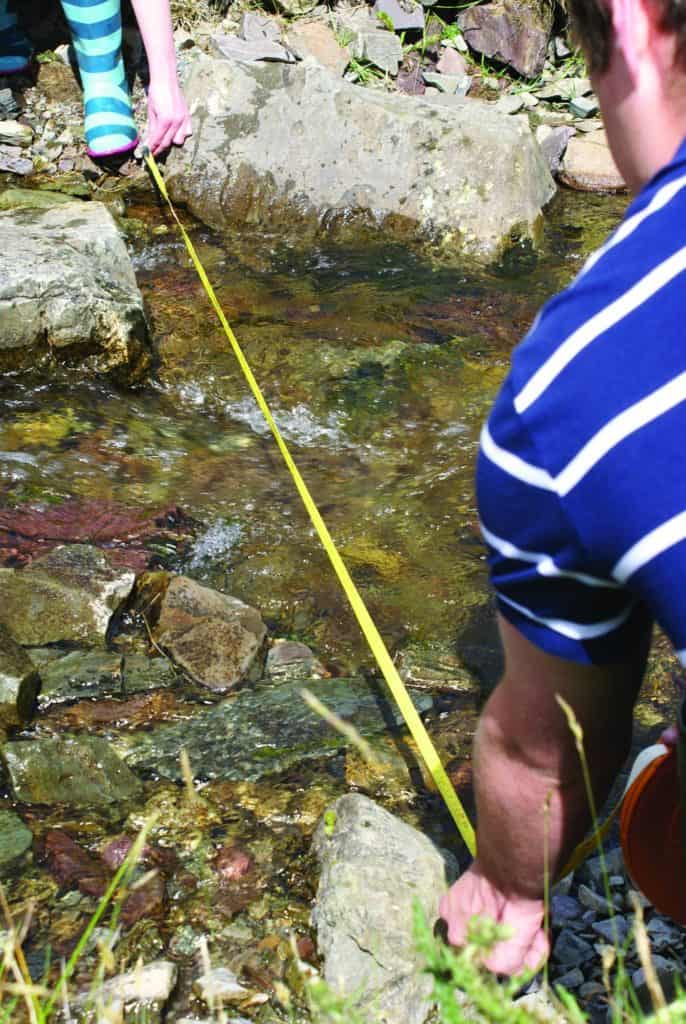
10. River velocity measurements using a float
You need at least two people for this method.
Measure 10 metres along the river bank. Make sure that you put markers at the start and finish.
Choose something brightly coloured that floats in water, such as an orange, a dog biscuit or a piece of cauliflower. Use a stopwatch to time how long the float takes to move from the start to the finish.
It’s pretty likely that at some stage the float will get stuck in an eddy! Either nudge the float to move it along or abandon that reading and start again.
Remember that \(\mathsf{velocity = distance ÷ time}\)
In this case
- distance = 10 metres
- time = number of seconds that the float takes to get from start to finish
Take repeat velocity readings at each site, such as left-hand side, centre and right-hand side of the channel. Calculate the mean velocity.
You can measure velocity and discharge using the float method. You need a 10m tape measure, a float (i.e. something that floats and is brightly coloured, such as an orange) and a stopwatch. You also need at least two people for this method.
Measure a set distance of the river and mark the start and end points. 10 metres is a good idea – it is long enough to show interesting variation in results, and a round number also makes the maths much easier! Put the float in the water slightly upstream of the start point. Using the stopwatch, time how long it takes the float to move from the start point to the end point. Repeat this procedure at least five times, placing the float at regular intervals across the stream so that you measure velocity across the channel.
It’s pretty likely that at some stage the float will get stuck in an eddy! Either nudge the float to move it along or abandon that reading and start again. The raw data that you have collected by this technique can be used to measure velocity and discharge.
11. Measuring channel geometry
At each sample site, measure
(a) Channel width – use a tape measure or rope held across the channel from bank to bank on the water surface.
(b) Channel depth – take a number of readings at regular intervals across the channel (e.g. ¼ across,1/2 across, ¾ across) to measure the depth from the water surface to the stream bed.
Use the width and wetted depth readings to calculate the cross-sectional area.
12. Calculating discharge
To work out discharge for any particular point you first need to have calculated mean velocity and cross sectional area for each sample site.
\(\mathsf{Discharge = mean\;velocity\;\times\;cross\;sectional\;area}\)
e.g. if mean velocity = 0.96 m/s and cross-sectional area = 1.25 m2
Discharge = 0.96 x 1.25 = 1.2 cubic metres per second (or cumecs)
Modelling the water cycle
13. Storm simulations
This is one area of Geography where you can carry out a scientific experiment. If you can get hold of some basic materials, you can easily build a model drainage basin. For this to be successful, you do need access to an area of open ground (such as a grassy field), with permission to carry out some ground disturbance, such as lifting turf and digging soil. It is not a project to carry out on someone’s prized lawn or flower beds.
A model drainage basin (called a storm simulation plot) can be used as an open-air laboratory to test the link between rainfall and runoff. From your results, you should be able to draw storm hydrographs for a range of different ground surfaces.
Step 1. Building a storm simulation plot
It is helpful to choose an area of slightly sloping ground for the plot.
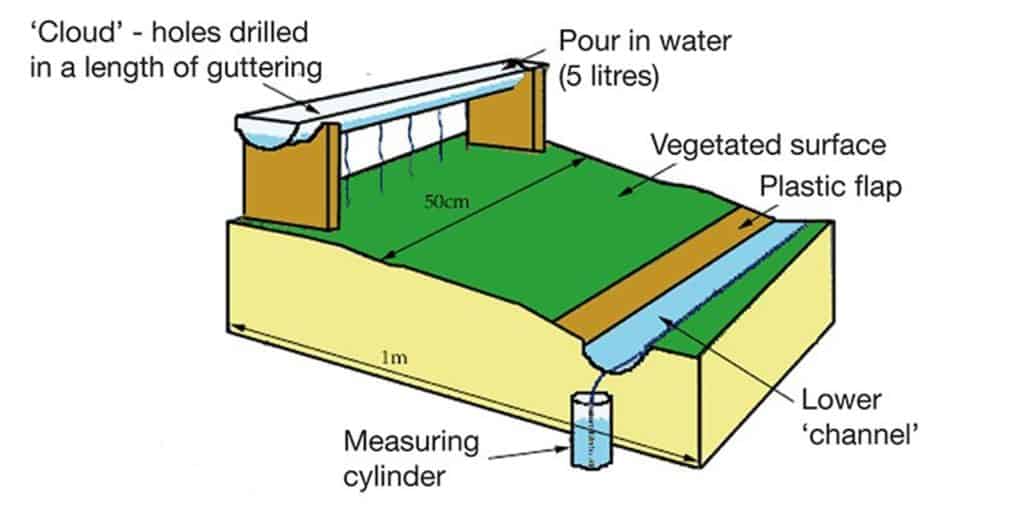
The diagram shows how a storm simulation plot could be constructed. You need the following materials
- two 50cm lengths of plastic guttering sealed at both ends (available from DIY shops)
- two blocks of wood of the same height – the exact height is not important, but they need to be high enough to hold the guttering off the ground (approx. 20cm in height will do).
- a polythene sheet large enough to cover whole plot when laid out flat (at least 1m x 50cm in area)
The first stage is to prepare one of the lengths of guttering to be your ‘cloud’. At roughly equal intervals along its length, drill five holes of the same diameter in the lowest point of the curved base of the guttering. The other length of guttering is your ‘river channel’. Remove the seal from one of the ends.
The blocks of wood are going to be used to hold up the length of guttering with the drilled holes (the ‘cloud’). They will need to be sawn into shape so that the guttering will remain in place (see diagram).
Now clear any grass or other vegetation from the land where you are going to build each plot. Lay the polythene sheet so that it covers the ground. You should aim to produce a shallow gradient of around 5-10 degrees from the top of the plot to the base. If the underlying ground surface is flat, use soil and turf under the polythene to lift it up at the ‘cloud’ end.
Fix the wood blocks at one end of the plot (ideally the uphill end). Place the guttering with the drilled holes (the ‘cloud’) on the wooden blocks. Place the second piece of guttering (the ‘river channel’) at the other end of the slope. Use waterproof duct tape or similar to ensure that there is a tight seal between the polythene sheet and the ‘river channel’.
Step 2. Preparing the ground surface of the plot
If you have been following these instructions up to now, you should have a plot covered in a polythene sheet. To simulate different ground surfaces (e.g. tarmac, grassland, ploughed farmland, etc.) you need to place different surfaces on top of the polythene. For each surface, follow the instructions in section (iii) to collect data.
If you are short of materials and/or space, you could use the same single plot for testing two or more ground surfaces. Alternatively, you could build more than one plot, although you will need to control variables such as slope angle.
Here are some suggestions for how you can simulate different ground surfaces. For an urban surface, such as tarmac, where you are aiming to make the ground surface as impermeable as possible, use the polythene sheet on its own. For a grassland surface, dig squares of undisturbed turf from nearby, and place these on top of the polythene. For a ploughed field surface, dig soil and spread this over the polythene.
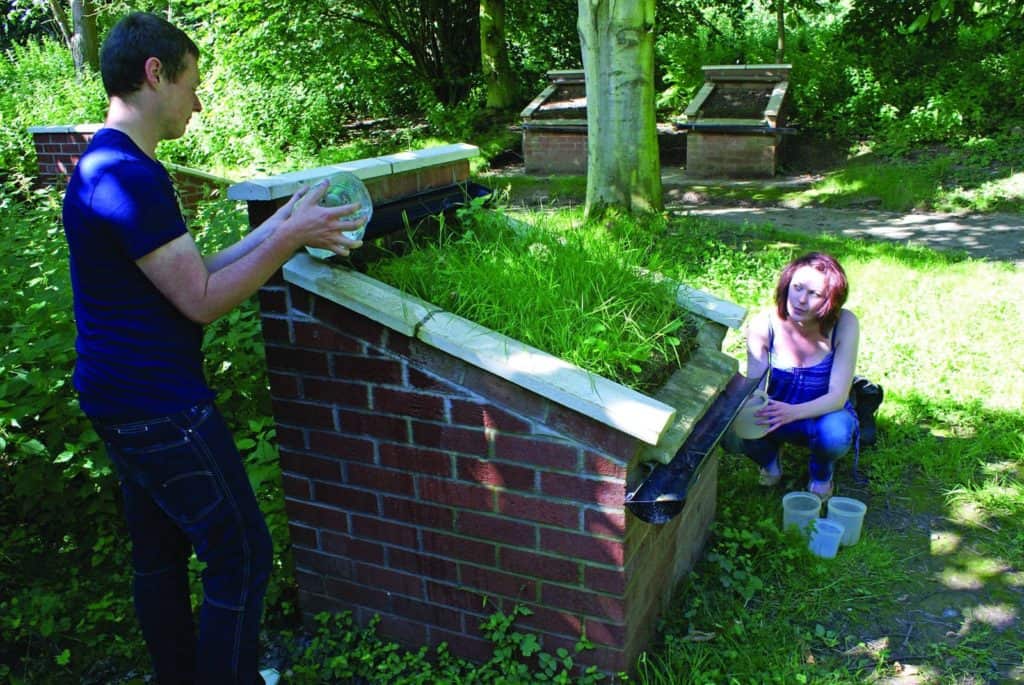
Step 3. Running the storm simulation and collecting data
You will need
- a stopwatch
- a measuring cylinder
- a plastic jug containing 5 litres of water
- at least 2 people – 1 to pour water into the ‘cloud’, another to operate the stopwatch and read the measuring cylinder
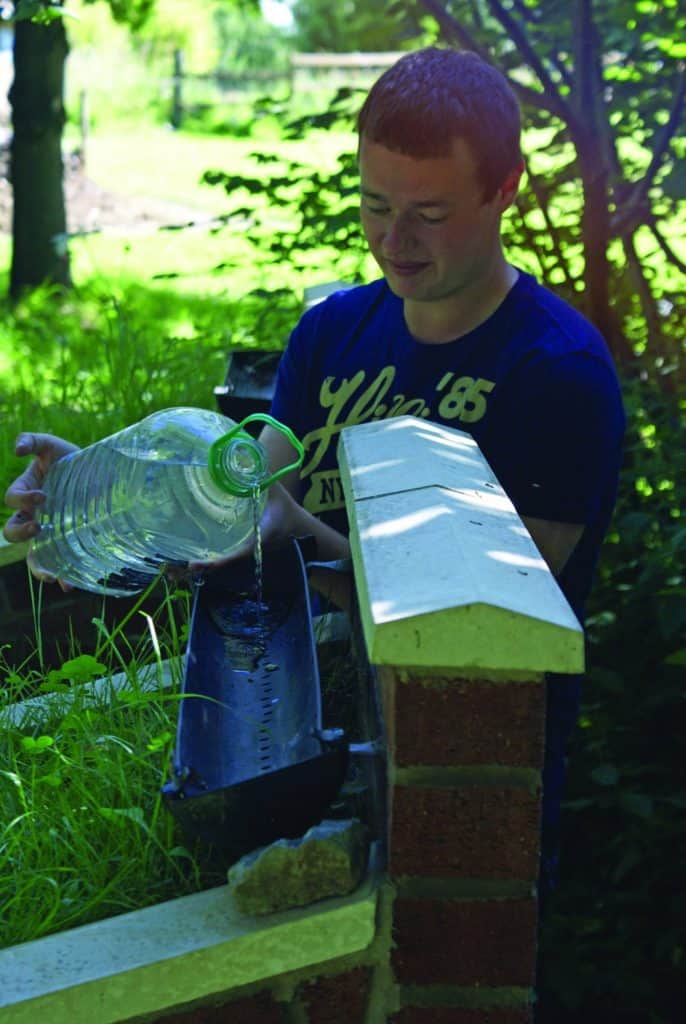
One person pours a set amount of water from a plastic jug into the top guttering (the ‘cloud’). Try to pour water at a steady rate, and to pour along the whole length of the cloud. Start the stopwatch as soon as pouring starts.
The other person uses the stopwatch first to record the initial response time, i.e. time it takes for the first drop of water to reach the ‘river channel’.
Then record the water level in the measuring cylinder (in millilitres) every 30 seconds for 6 minutes from the start of pouring. Empty the measuring cylinder after every reading, and record a separate figure in millilitres for each 30 second interval. You might need to use two measuring cylinders in rotation if the water is flowing rapidly out of the ‘river channel’ (particularly for the urban ground surface).
Secondary data sources
1. Weather data
It is also useful to obtain weather data for the weeks before your fieldwork. The Met Office archive is an excellent place to start. It provides monthly summaries back to 1998, with links to older station data as well.
2. Drainage basin characteristics
The first place to start is the Catchment Data Explorer.
For more information about the rocks and other sediments in the drainage basin, the British Geological Survey’s site Geology of Britain is a superb geographical information system.
3. Runoff data
There are several useful sources of hydrological data for the UK. The National River Flow Archive, River Level data and the Environment Agency river and sea level website may be useful.

Secondary and Further Education Courses
Set your students up for success with our secondary school trips and courses. Offering excellent first hand experiences for your students, all linked to the curriculum.
Group Leader and Teacher Training
Centre-based and digital courses for teachers