Present your findings with a range of quantitative and/or qualitative techniques. Each technique should be accurately drawn and appropriate for the information being presented. Here are some suggestions.
River regimes
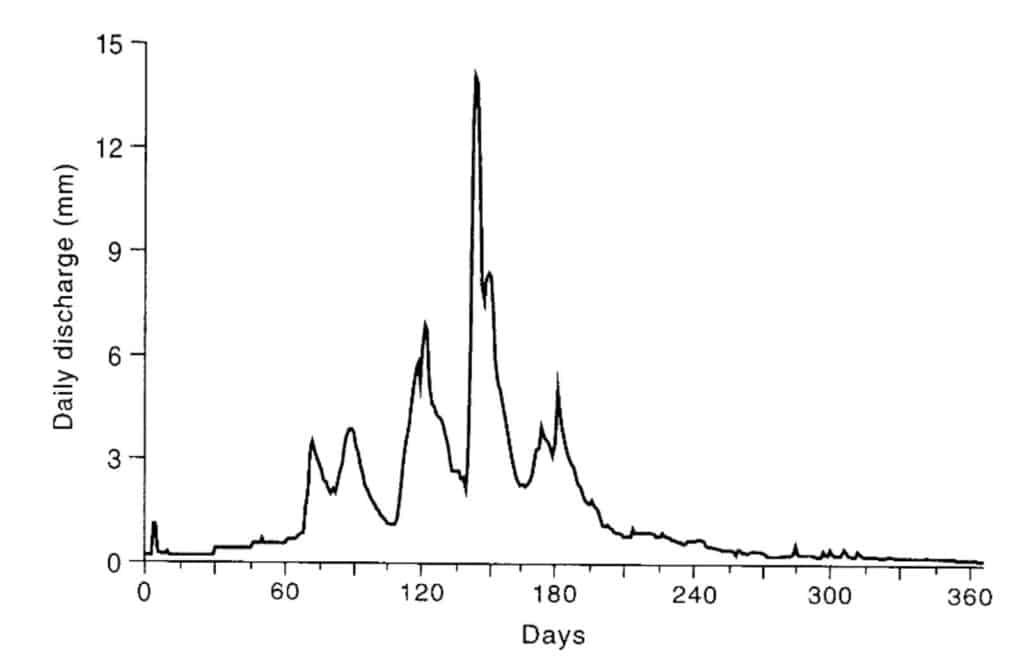
You can use secondary data to construct a river regime graph. Plot discharge on the y-axis and date on the x-axis. Note that the conventional water year runs from 1 October to 30 September, as show in the example below. Plotting the graph from autumn to autumn avoids splitting the winter floods.
Storm hydrographs
You can combine data you have collected yourself (such as stream discharge) with rainfall data from secondary sources to construct a storm hydrograph. Time is plotted on the x-axis. There are two y-axes, with a line graph for discharge and a bar graph for rainfall. It is often useful to draw the line graph and the bar chart as parallel but separated graphs.
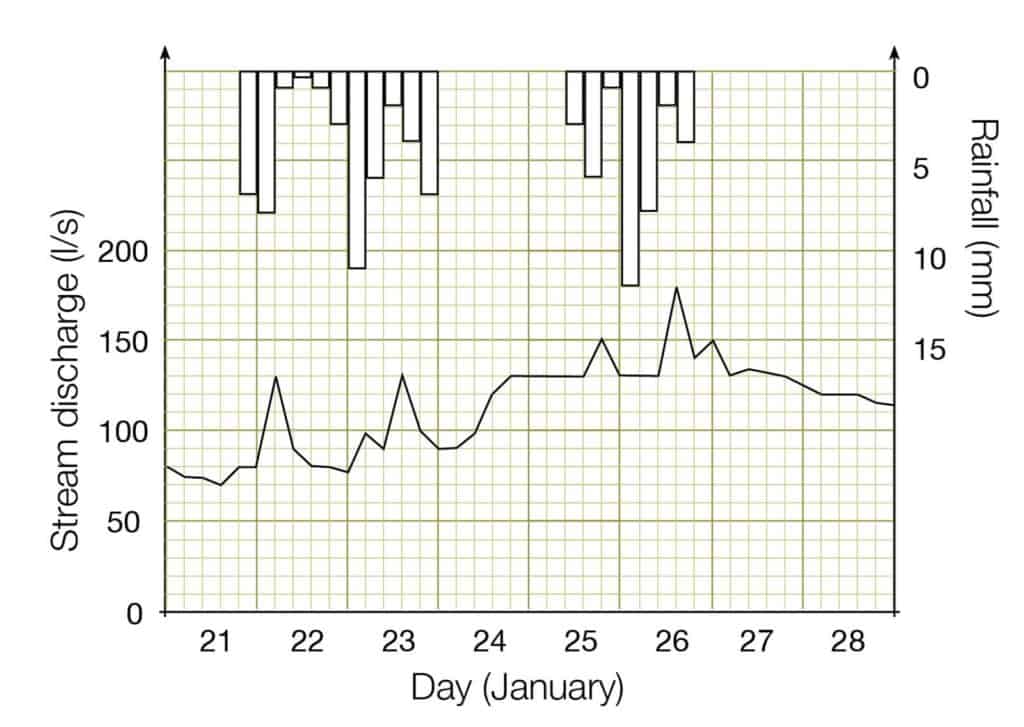
The hydrograph shows stream discharge (in litres per second) and rainfall for 7 days at the end of January for a small stream in south-west England. Notice how a hydrograph constructed using real-world data does not always look like a textbook storm hydrograph.

Secondary and Further Education Courses
Set your students up for success with our secondary school trips and courses. Offering excellent first hand experiences for your students, all linked to the curriculum.
Group Leader and Teacher Training
Centre-based and digital courses for teachers