IB Biology (and ESS) – 4 Days
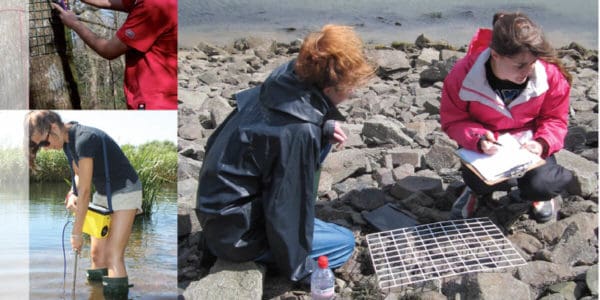
This 4 day IB Biology fieldwork course offers an unrivalled opportunity for students. We will develop their skills in the study of biology and deepen their understanding of ecological content in a variety of inspiring habitats before successfully undertaking a scientific investigation as part of the…