All Geography starts with someone going into the field to find out what’s there. This section will help you to gather the primary data (data you collect yourself) and secondary data (data collected by someone else) that will support your analysis and conclusions.
| Type of data | Primary data collection technique | Secondary data collection source |
|---|---|---|
| Characteristics of urban places | Urban drifting Placechecks tool Townscape survey Clone Town survey | Index of Multiple Deprivation Natural landscapes Cultural landscapes Historic townscapes Historic landscapes |
| Characteristics of rural places | Placechecks tool Rural character survey | Index of Multiple Deprivation Natural landscapes Cultural landscapes Historic townscapes Historic landscapes |
| Perceptions of place | Questionnaires Interviews Mental mapping Emotion mapping | Social media |
| Lived experience of places | Observation studies Pedestrian footfall Sensory mapping | Social media |
Characteristics of urban places
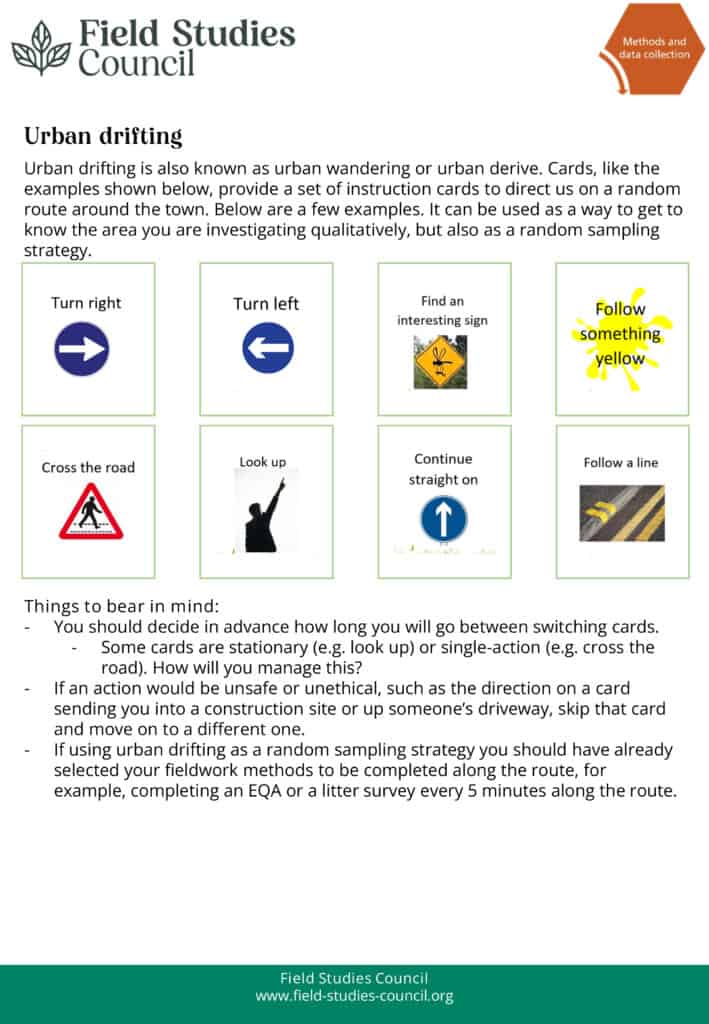
1. Urban drifting
This is a useful way to explore places. The aim is to take a journey through a place and make a record of what you experience.
Try taking a large scale street map of a city and trace out a circle on it. Your task is to walk as close to the edge of the circle as you can. Or create a random walk. You could roll a dice at each road intersection to decide which way to turn.
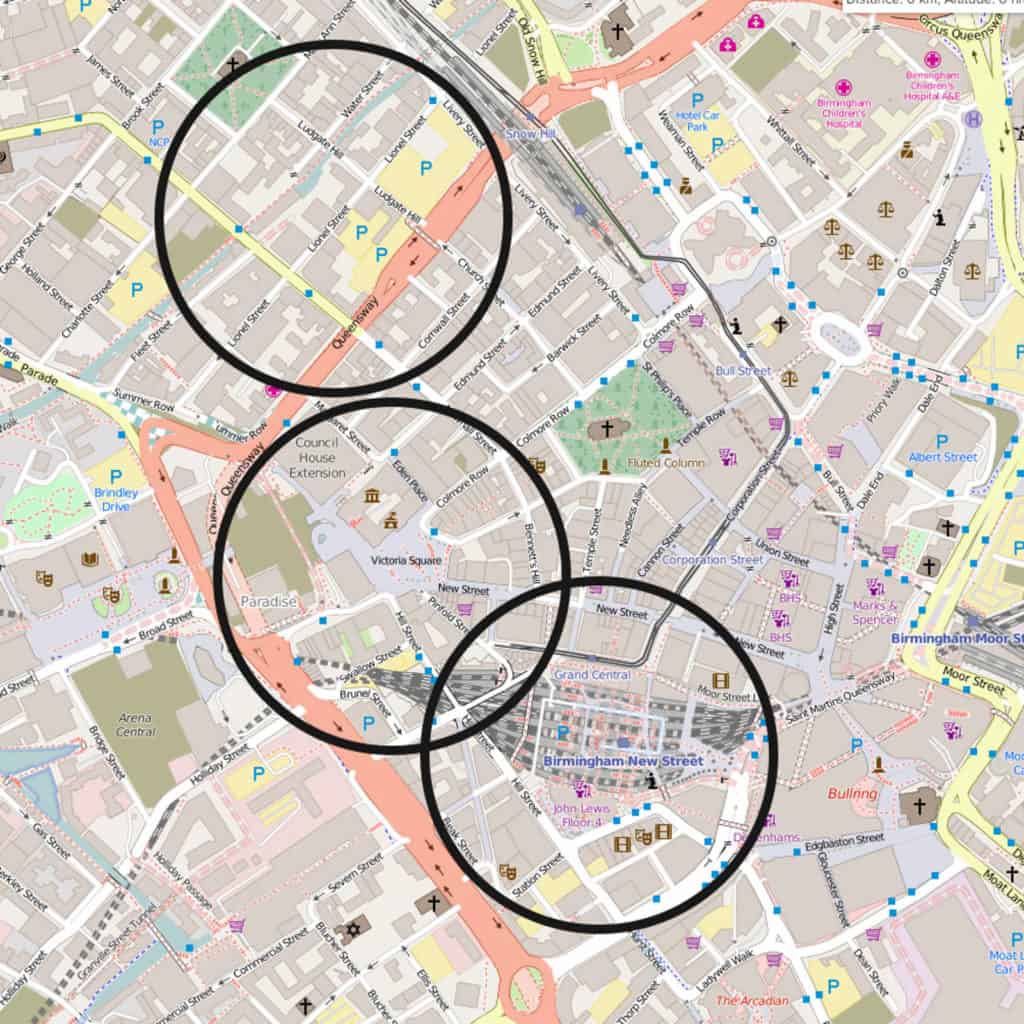
Exploring Birmingham city centre by tracing circles. The number, size and location of the circles is up to you.
On your journey though the place, make a record of what you see, hear and smell. Stop regularly to make written notes. You could also take photographs or a video recording of the journey.
Take a look at this resource for an example of Urban Drifting Cards and how they can be used to create a random route in your investigation area:
2. Placechecks
Placechecks is another way to start exploring a place. You can find out much more at the Placechecks website.
Imagine that you are a local resident. For each location that you visit, ask:
- What do you like?
- What things need protecting?
- What don’t you like?
- What needs changing now?
- What problems are getting worse?
The Placechecks walkabout has a list of 21 questions to ask to help explore what makes places special.
3. Townscape survey
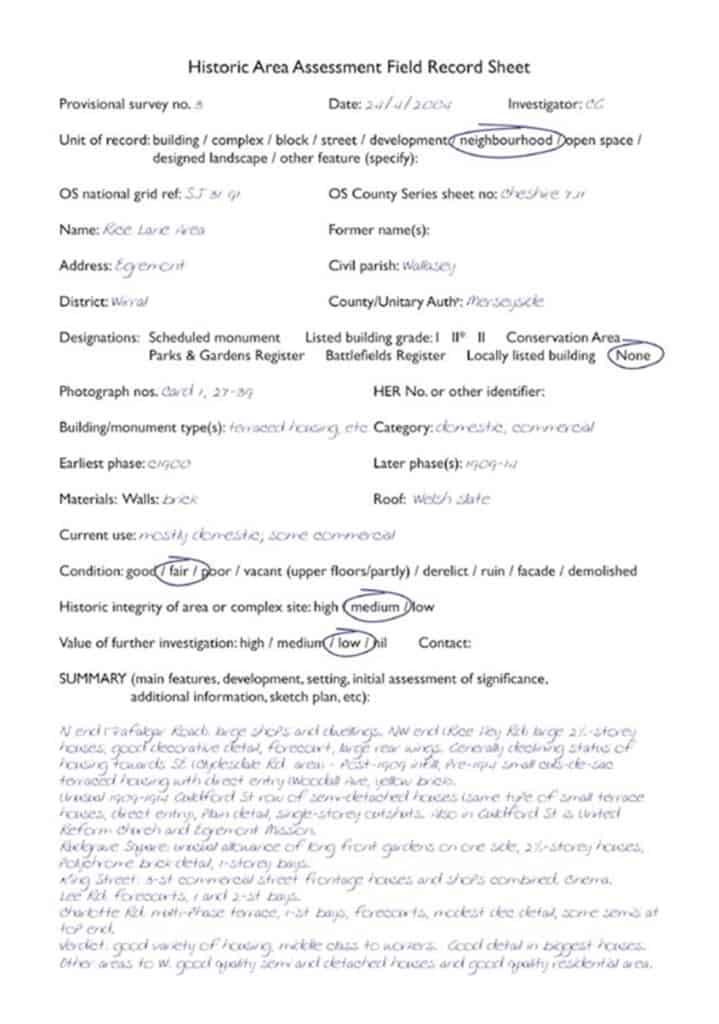
Historic England have developed the Historic Area Assessment.
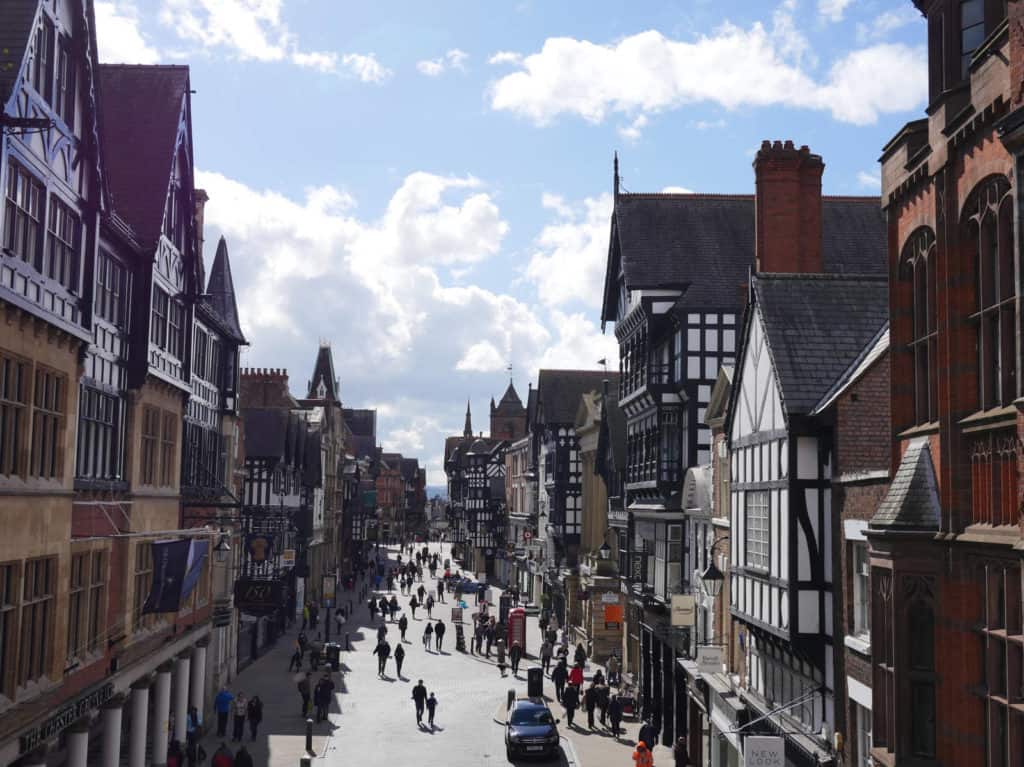
This helps assess the character and significance of historic areas, such as town centres, older suburbs or villages. Here is an example of a completed Historic Area Assessment recording sheet.
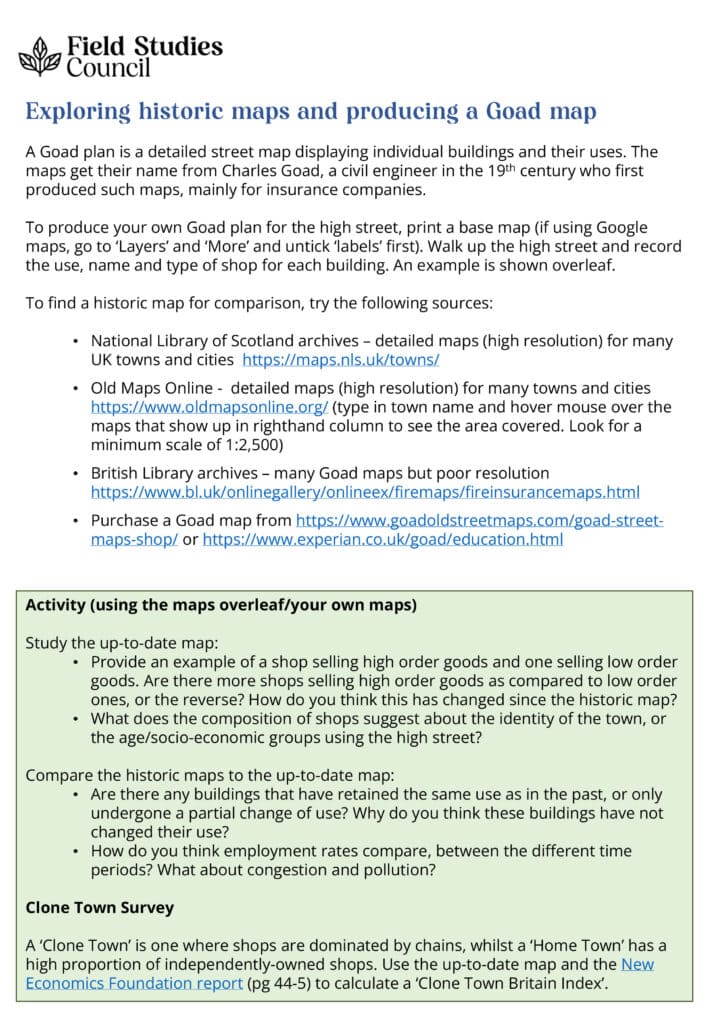
4. Clone Town survey
The New Economics Foundation (NEF) have argued that shopping streets in Britain are steadily becoming more similar. These Clone Towns are dominated by a narrow range of chain stores rather than independent shops.
Use a GOAD map and/or a pilot survey of the town to determine the boundaries of the shopping areas of each town. Include all indoor shopping centres.
Visit all streets in the shopping area and categorise every shop into 1 of 25 categories using the NEF survey form on page 45 of this report. Carry out this work methodically, making a careful note of when streets have been surveyed. Use the formula on page 44 of the same report to determine whether your town is a Clone Town or not.
Retail value
As well as making an overall survey of the degree of cloning, it is possible to look at individual streets of the town centre in more detail. There are likely to be areas of higher and lower retail quality. One way in which this can be done is to choose a study area, then score each shop within the area as follows
| Shop type | Score |
|---|---|
| Department store | 5 |
| High street chain | 4 |
| Independent specialist shop | 3 |
| Convenience store | 2 |
| Charity shop | 1 |
| Vacant retail premises | 0 |
This is based on the assumption that large shops like department stores act as ‘anchors’, attracting many shoppers, while smaller shops have a lower attractive pull. Add all the scores together to calculate the retail value for the area. Worked example
| Shop type | Score | Number in High Street | Number in Market Street |
|---|---|---|---|
| Department store | 5 | 3 | 0 |
| High street chain | 4 | 10 | 2 |
| Independent specialist shop | 3 | 7 | 7 |
| Convenience store | 2 | 2 | 2 |
| Charity shop | 1 | 0 | 6 |
| Vacant retail premises | 0 | 0 | 2 |
| TOTAL RETAIL QUALITY | 80 | 39 |
In this example, High Street has a higher retail value (80) than Market Street (39).
Characteristics of rural places
5. Rural character survey
Natural England have classified England’s rural landscape into 159 National Character Areas (NCAs).
For example, NCAs in south-west England include Mendip Hills, Isle of Portland and Dorset Heaths. Many county and district councils have subdivided NCAs into smaller units; for example, Devon County Council.
Choose at least 5 survey sites around the location, possibly randomly. Design a booking sheet which will allow you to collect information on both the natural environment and the cultural landscape. An example of a booking sheet is shown below.
Perceptions of place
6. Questionnaires

Questionnaires are useful for finding out more about people’s
- characteristics (e.g age, sex, place of residence)
- behaviour (e.g. usage of the coast)
- attitudes (e.g. do they agree with a scheme for managed retreat?)
An effective questionnaire contains a mixture of closed and open questions:
Closed questions: answers are limited to single words, numbers of listed options
e.g. “Do you feel safe in Church Street at 8pm?
Possible answers YES or NO
Closed questions can also be given as a statement. Responses are limited to positions on a scale. There are two ways of presenting statements:
(i) Semantic differential scale – use pairs of words and a scale from negative to positive.
e.g. What do you think of the village of Horton-in-Ribblesdale?
Ugly -2 -1 0 +1 +2 Beautiful
Boring -2 -1 0 +1 +2 Lots to do
Dead -2 -1 0 +1 +2 Vibrant
(ii) Likert scale – ask participants whether they agree or disagree with a series of statements. Use statements with a balance of positive and negative.
e.g. “I do not feel in danger walking around Stokesley in the evening.
Answers: Strongly agree / Agree / Don’t know / Disagree / Strongly disagree
(iii) Rating – ask participants to rank a small number of categories from most important to least important.
e.g. What was your main reason your chose to live in this neighbourhood? Please rank the following statements from 1 (most important) to 6 (least important)
Answers: proximity to work, proximity to family and friends, proximity to schools, housing costs, pleasant environment, good place to raise children
Open questions: responses may be long and detailed. Often it is a good idea to word the question so that people could respond with positive answers, negative answers or a mixture of the two. Asking participants to focus on a specific area or time frame may be more effective than just asking “Any other comments?” or “What do you think about this town?” at the end of a questionnaire.
e.g. “Do you think this town will get better or worse in the next 20 years? Why?”
7. Interviews
A properly conducted interview is more than just having a chat with someone. It needs to be carefully planned. You should take detailed notes or, even better, with the particpants’ permission make an audio or video recording so that you can type up a transcript of the event.
(a) Interview strategies
Interviews can be structured, semi-structured or unstructured. In a structured interview, each participant is asked the same questions in the same order. In an unstructured interview, you set a focus for the interview with perhaps one or two introductory questions to break the ice, but allow the discussion to develop naturally. A semi-structured interview is a combination of the two approaches, with some pre-prepared questions but with time for discussion.
If you are using the structured or semi-structured route, prepare a typed list of questions beforehand. 6-8 questions is a realistic aim for a 30 minute interview. If you are using the unstructured route, prepare a list of general issues that you would like to cover in the interview. This will help you steer the discussion so that it covers all the issues, as otherwise conversations may drift.
(b) Choosing people to interview
Interviews can also be carried out individually or in groups. They can be carried out face-to-face, over the telephone or online (e.g. by Skype). Focus groups are a type of unstructured or semi-structured interview in which a group of people discuss topics defined by a researcher.
It is impractical to select a representative sample of people to interview. Instead use non-probability sampling, in which the sample is selected through the subjective judgment of the reseacher. There are three techniques:
Convenience sampling: select people who are easy to reach, e.g. interview existing contacts, such as friends and neighbours.
Snowball sampling: select at least two people. Ask each person to help you find more interviewees. Continue finding new people until you have achieved your desired sample size.
Quota sampling: deliberately select a proportionate number of people from each part of the population.
(c) Choosing questions to ask
There are two issues to consider here: what types of questions that you want to ask, and the order in which you want to ask them.
Consider the following types of question:
(i) Descriptive: questions which ask for facts about people, places and experiences, e.g. “How long have you lived in this town?”
(ii) Storytelling: questions that ask participants to put events in order, e.g. “Can you tell me how this town has changed since you first moved here?”
(iii) Opinion: questions that ask about perceptions and feelings, e.g. “Is there enough for teenagers to do in this town in the evening?”
(iv) Stuctural: questions that ask people to reflect on why they hold particular opinions, e.g. “How do you think you came to hold that opinion?”
(v) Contrast: questions that ask people to put themselves in someone else’s shoes, e.g “Would you think differently about how safe the town centre if you were male/female/elderly/young?”
Often the hardest part of the interview is the start. Careful ordering of questions will help you build up rapport with the participants and maintain momentum over the course of the whole interview. Think of the interview are structured like a pyramid, with the easy-to-answer descriptive questions near the start and the most abstract questions (like structural and contrast questions) near the end. Ensure a polite finish (e.g. “Thanks for your time. You’ve given me some really useful information from this interview”).
Some interviewees will be more chatty than others. Nudge less chatty interviewees with prompt questions (e.g. “What do you mean by that?” when an answer is unclear or incomplete). Eye contact, smiling and nodding will let the interviewee know that you are interested in what they have to say, and will encourage them to say more – don’t yawn at them!
8. Mental mapping
The most likely victim of street crime in Britain is a man aged 16-24 (Office for National Statistics). But the fear of crime is different; it is to do with perception. You could investigate this through questionnaires, or by asking people to construct mental maps.
Mental mapping is a technique which allows you to collect a lot of quantitative data on people’s perceptions of space. Mental maps are particularly useful to capturing data on whether people perceive places as threatening, unsafe or otherwise undesirable.
Photocopy a base map of different places in an area, such as 10 contrasting wards in a city. Ask each participant to colour in each place on the following scale. Remind participants that they should be thinking about 24 hours a day and 7 days a week.
This place is always unsafe – colour in RED
This place is sometimes unsafe – colour in ORANGE
I don’t know this place – colour in BLUE
This place is mostly safe – colour in YELLOW
This place is always safe – colour in GREEN
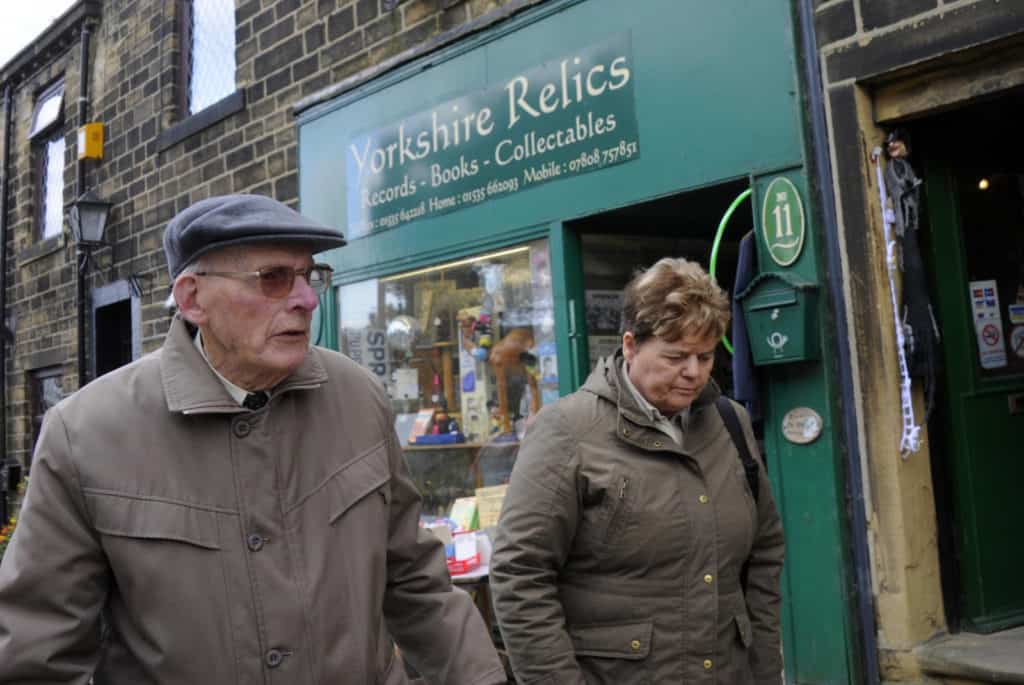
9. Emotion mapping
Emotion mapping involves recording your own feelings and emotions as you move around a fieldwork location. It is a very objective method as it is heavily based on your own personal opinion but it can be combined with a more subjective approach, such as an Environmental Quality Assessment or Index of Decay, to gain an understanding of how people may be emotionally impacted by the spaces around them.
Some methods use ratings of mood from high to low, or a selection of emojis that can be selected at each location to show how you are feeling. One of the most popular methodologies was created by Yale University. This method categorises feelings into 64 descriptive words organised along 2 scales based on the Energy and Positivity of the emotions.
The emotion scale created by Yale University:
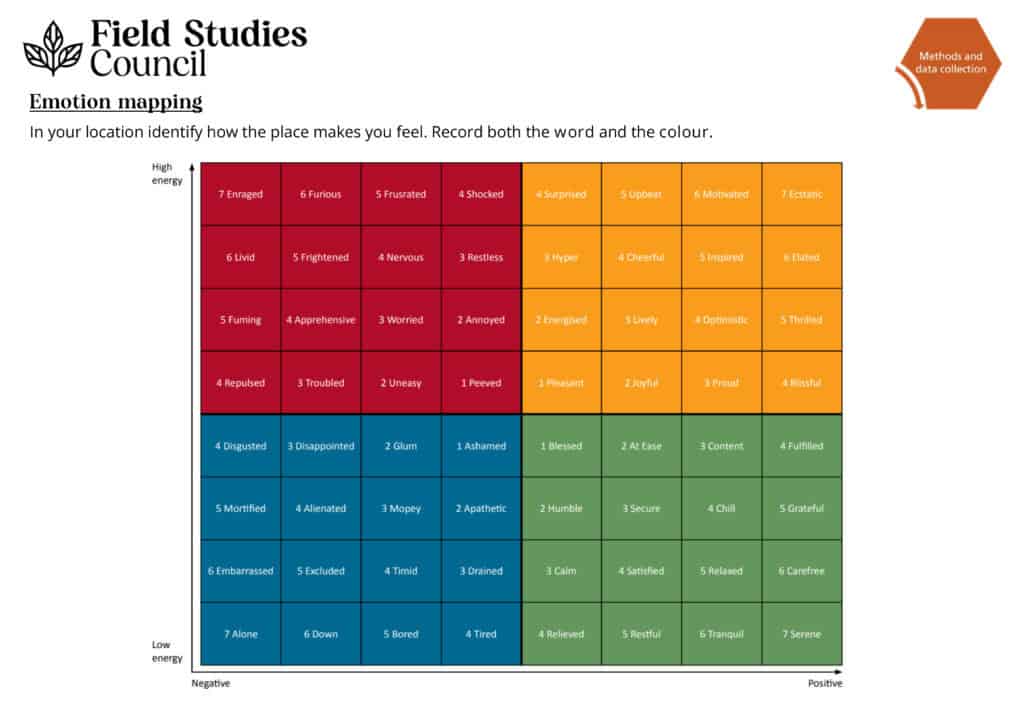
Download the emotion scale here
Lived experience of place
10. Observation studies
Observation is about watching what people do in particular places. Observational data is commonly recorded as notes, sketches or audio/video recordings. It is a very useful tool for finding out more about people’s lived experience of places.
An observation study is straightforward to carry out in an area which can be seen in full, such as a town square or small park. But this is not the only way. Sensory mapping and pedestrian counts are also forms of observation studies.
Record the number of users in the site over a time period (perhaps 30 minutes or 1 hour). Then you can do either or both of the following:
First classify them by age, sex and activity (e.g. shopper, delivery worker, dog walker). Use symbols and abbreviations to allow you to record observations quickly. This could be as simple as e.g. 65+ F Sh, for a female shopper aged over 65.
Second use a base map, and attempt to trace the movement across the site made by a sample of the site users.
Broadly there are three ways that you can carry out observation studies:
(i) Naturalistic observation: observing people in their natural environment. For example you could sit on a park bench to observe users in a park, or at a coffee shop with outdoor seating to observe users in a town square. Your aim is to be as unobtrusive as possible, so as not to influence people’s behaviour.
(ii) Participant observation: observing behaviour as a participant in a group. For example you could carry out a paper delivery round and watch people’s use of space at the same time. If you have a part-time job in a shop or café you could use this as an opportunity to observe people’s behaviour around you. If you belong to a sports club or gym, you could use the opportunity to construct an observation study around that (e.g. do people who take part in a running club have a different lived experience of a local place compared to people who do not?)
(iii) Controlled observation: observing behaviour under certain conditions and/or at certain times. You could, for example, decide only to observe certain types of behaviour in a park (such as dog walking) and ignore other behaviours. Or you could observe at specific times of day (e.g. Saturday morning 9-12). All controls on the observation need to be justified.
11. Pedestrian footfall
Pedestrian surveys are a type of observation study.
Think about which day of the week to count pedestrians. Pedestrian numbers are likely to be higher on a Saturday or Sunday then during the week, during school holidays, during dry weather and if there is a popular event happening in the city centre
Time of day is also important. Pedestrian numbers are likely to be higher during “rush hours” (like 8am-9am) or shift changes and during office lunchtime. Around 11am and 2.30pm are often good times to choose.
You need at least 20-25 survey points. Choose survey points across the city centre. If you are working in groups, each group can walk different routes across the city centre.
This is up to you, but make sure that you survey in the same way each time. Think about
How long to count pedestrians for – 2 minutes is enough. If your survey points are close together (perhaps every 100 metres), you might be able to do 3 or 4 pedestrian counts in 10 minutes.
Whether to count people on one side of the road or both sides of the road – if you are working in groups, different members of the group could count different sides of the road, with someone else holding a stopwatch.
12. Sensory mapping
Sensory mapping is a type of observation study. It a great way to get a handle people’s lived experience of places. What do they see? What do they hear? What do they smell? What do they feel about particular places?
Here are two ideas that you could consider:
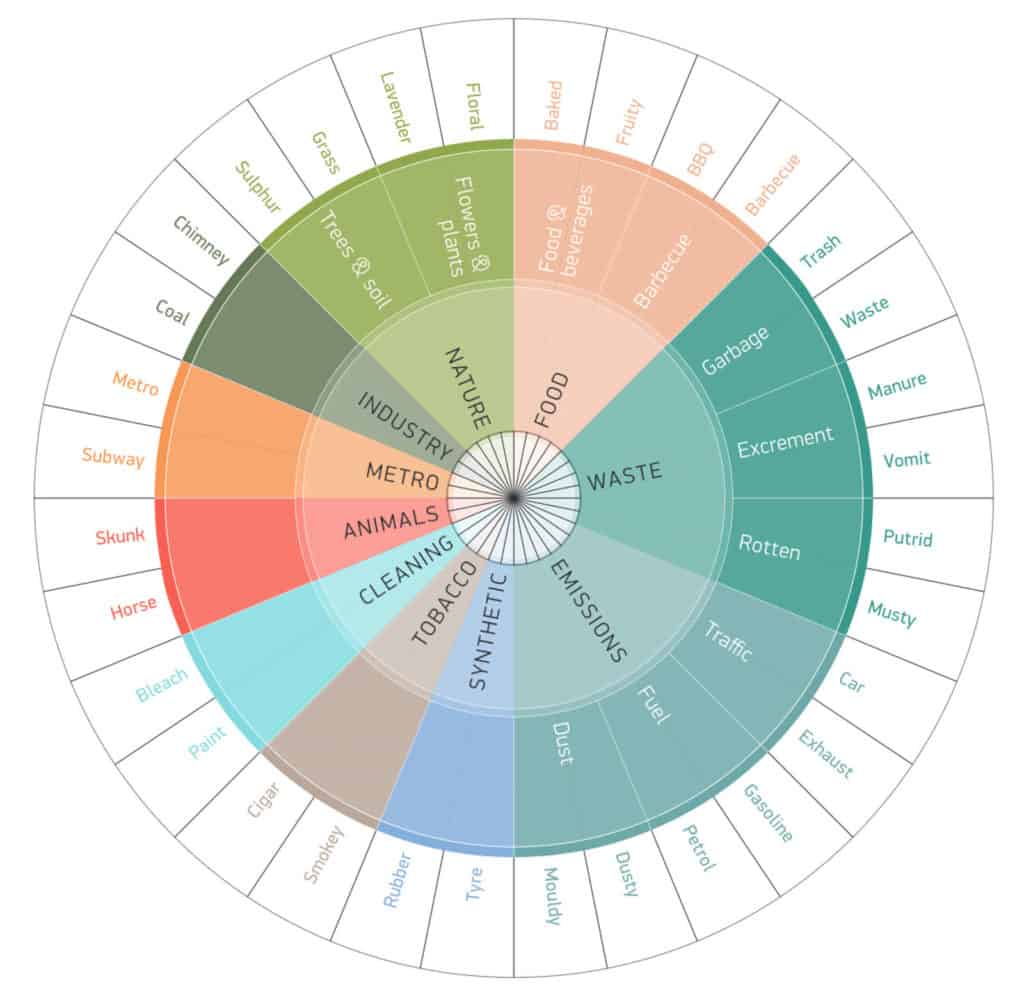
(a) Mapping smell and smellscapes – Smelly Maps is a project to classify the smell of different urban areas, both good and bad. The Aroma Wheel below (link to pdf) was developed for cities in the USA, but could be simplified and adapted to both urban and rural areas.
(b) Mapping sound and soundscapes
Sound levels (i.e. loudness) can be measured using a decibel meter. Smartphone noise meter apps are also available.
At the same tide as loudness is measured, you can also record the sources of noise if you can identify them (e.g. traffic – engine noise, gear changes, rolling contact with road surfaces; natural sounds like birdsong and wind) and the frequency of each sound. One way to standardise this method is to spend 2 minutes standing still at each site and noting the loudness, direction, distance and source of each noise that you hear.
Secondary data sources
1. Index of Multiple Deprivation (IMD)
2. Natural landscape
3. Cultural landscape
Settlement patterns and field shapes can be seen on a 1:25000 OS map
Victoria County History victoriacountyhistory.ac.uk
Genuki: a gateway to access historic information for most small settlements in England www.genuki.org.uk
4. Historic townscapes
Archives of the Extensive Urban Surveys project http://archaeologydataservice.ac.uk/archives/view/EUS/
England-wide programme of surveys into the archeology, historic buildings and townscapes of towns and cities. Can be searched by county. Some counties have not yet been completed.
Information on how to create a ‘Goad map’ showing individual buildings on a street and their uses can be found below. This can be used to show historic as well as current land use:
5. Historic landscapes
Archives of the Historic Landscape Characterisation project
England-wide programme of surveys into the landscapes of historic places, both rural and urban. Can be searched by county or smaller area. For example, the Black Country Historic Landscape Characterisation includes text, maps and GIS for the historic urban and industrial landscapes of Woleverhampton, Walsall, Sandwell and Dudley. Some counties have not yet been completed.

Secondary and Further Education Courses
Set your students up for success with our secondary school trips and courses. Offering excellent first hand experiences for your students, all linked to the curriculum.
Group Leader and Teacher Training
Centre-based and digital courses for teachers