Secondary Data
Your primary data will focus on spatial changes in a river channel. Secondary data is invaluable for considering the potential for temporal changes and their impacts.
Use Gauge Map to find the nearest Environment Agency gauging station to you. Trace the river you have studied downstream to find the first gauging point.
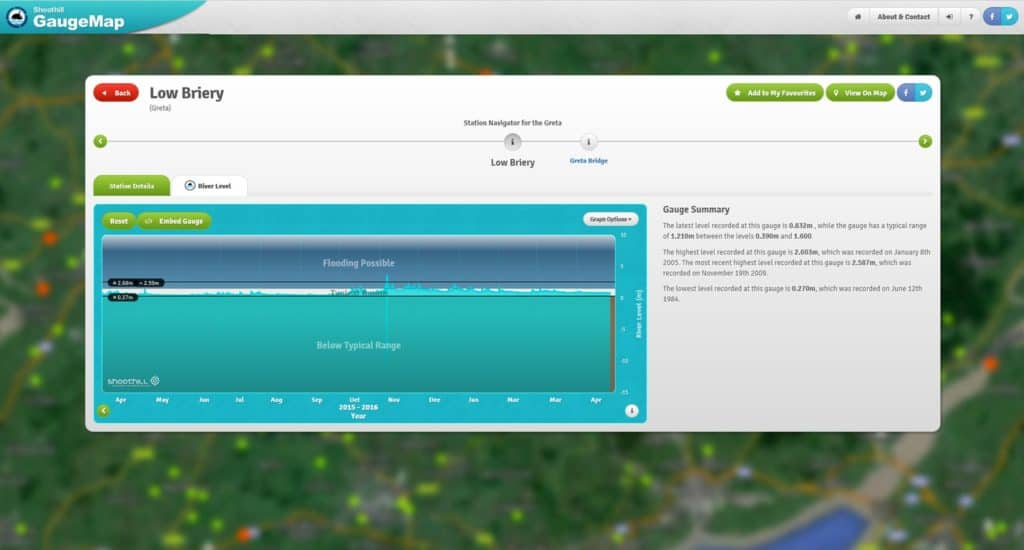
For any gauge you can view the last 12 months river levels (River Level and or River Discharge). This can give you an idea of the seasonal variation and any associated flood events.
You may be able to compare the magnitude of difference between the time of year you visited and its typical range or the maximum and minimum values for the last 12 months.
\(\mathsf{Gauge\; level\; on\; day\; of\; visit = 0.832m}\) \(\mathsf{Maximum\; gauge\; level\; in\; the\; last\; 12\; months = 3.750m}\) \(\mathsf{\frac{3.750}{0.832} = 4.507}\) \(\mathsf{Maximum\; gauge\; level\; was\; 4.5\; times\; the\; level\; on\; the\; day\; we\; visited}\)The data from the gauging station suggests that at a river level of greater than 1.6 metres flooding is possible.
Environment Agency Flood Risk Map shows areas at risk of flooding in England. Check My Flood Risk which uses the same data as the EA map, but in a slightly more user friendly view.

Secondary and Further Education Courses
Set your students up for success with our secondary school trips and courses. Offering excellent first hand experiences for your students, all linked to the curriculum.
Group Leader and Teacher Training
Centre-based and digital courses for teachers
Experiences for Young People
Do you enjoy the natural world and being outdoors? Opportunities for Young People aged 16-25.