Before you start
Quality of life
Quality of life is a broad multidimensional concept that usually includes subjective evaluations of both positive and negative aspects of life.
Quality of life is traditionally difficult to define as it can mean different things to individuals. Despite this there are some common themes which permeate most definitions of quality of life.
Key indicators of quality of life include:
- health
- employment
- education
- housing
- schools
- the neighbourhood
Aspects of culture, values, and spirituality are also part of quality of life, assessing these more individual aspects often makes the assessment of quality of life more complex.
Deprivation
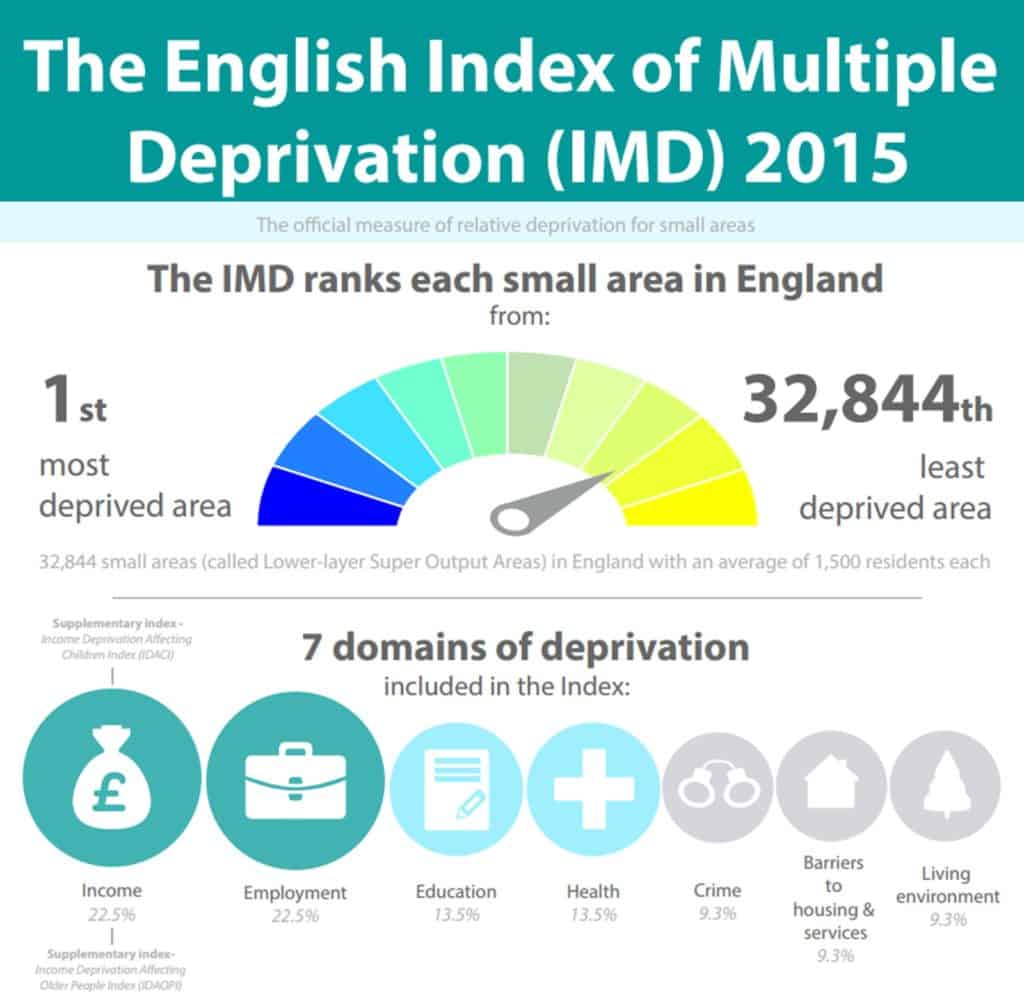
Deprivation is often used as an inverse measure of quality of life. Indices of Deprivation, such as the English Indices of Multiple Deprivation, IMD, WIMD in Wales and SIMD in Scotland. These use statistics from the Census and other secondary sources to assign a score. Neighbourhood areas (Census Lower Layer Super Output Areas, LSOA’s) are then ranked based on this score.

The English IMD uses 37 indicators of deprivation from 7 domains of deprivation. These include data from census, HMRC, police statistics and other sources. This means that IMD are updated more frequently than census data – typically every 3-5 years.
A local example
Questions will often focus on comparing two or more areas with different levels of deprivation – investigations such as this involve use of Census data as a significant portion of the primary data – it is therefore worthwhile using Census Geographies in planning your primary data collection. Find out more about the UK Census Geographies

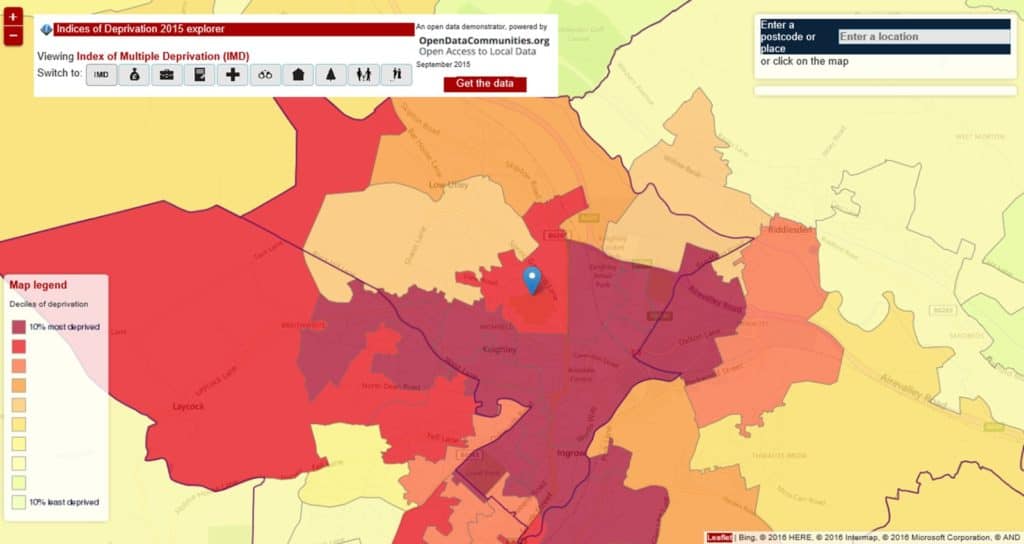
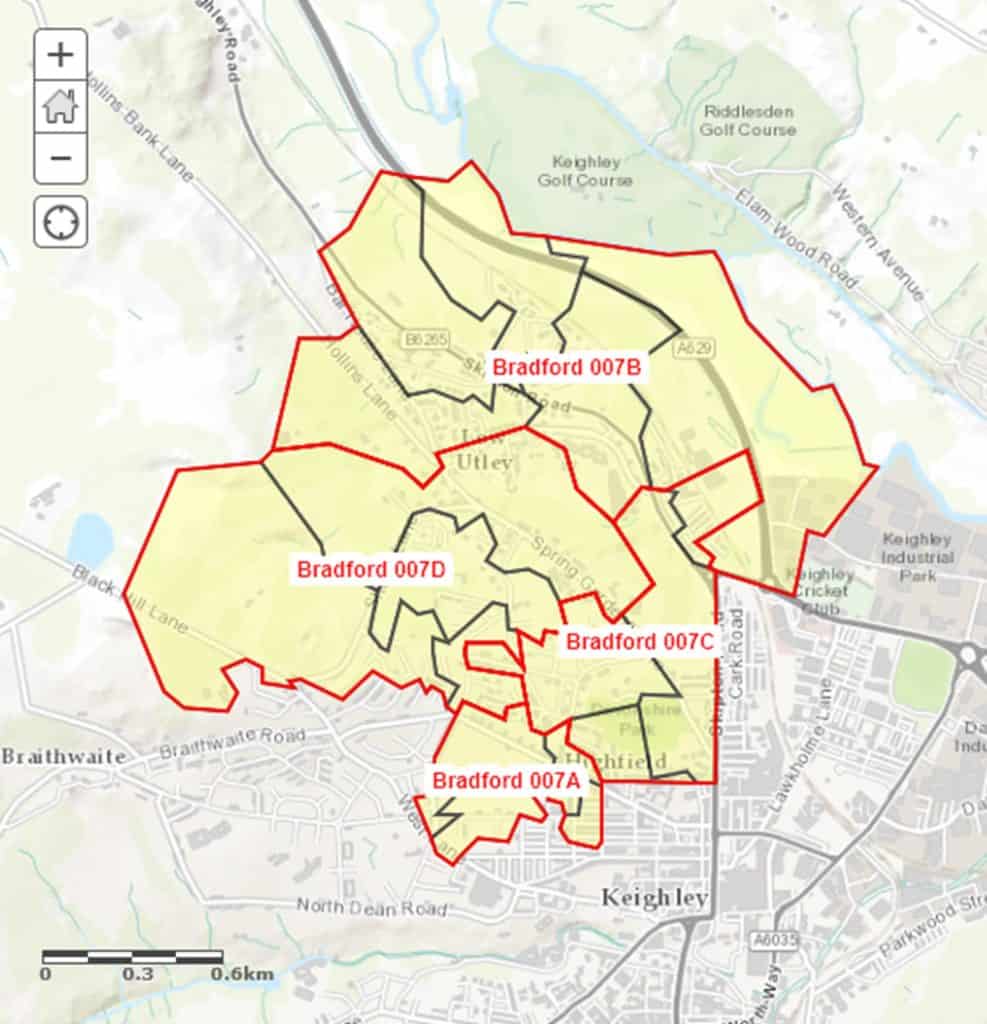
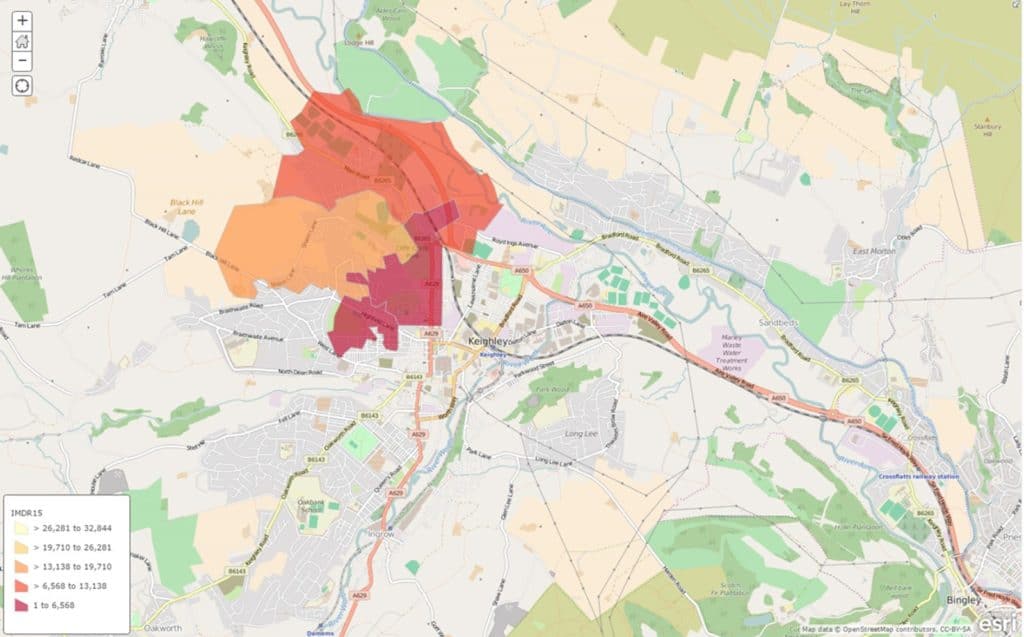
Looking at the IMD 2015 data for Keighley it is possible to identify contrasting areas – we have selected one Middle Layer Super Output Area (MSOA) to study: MSOA Bradford 007, which contains 4 LSOAs with varying levels of deprivation according to the IMD 2015.


Secondary and Further Education Courses
Set your students up for success with our secondary school trips and courses. Offering excellent first hand experiences for your students, all linked to the curriculum.
Group Leader and Teacher Training
Centre-based and digital courses for teachers
Experiences for Young People
Do you enjoy the natural world and being outdoors? Opportunities for Young People aged 16-25.

