Quantitative methods
Sampling
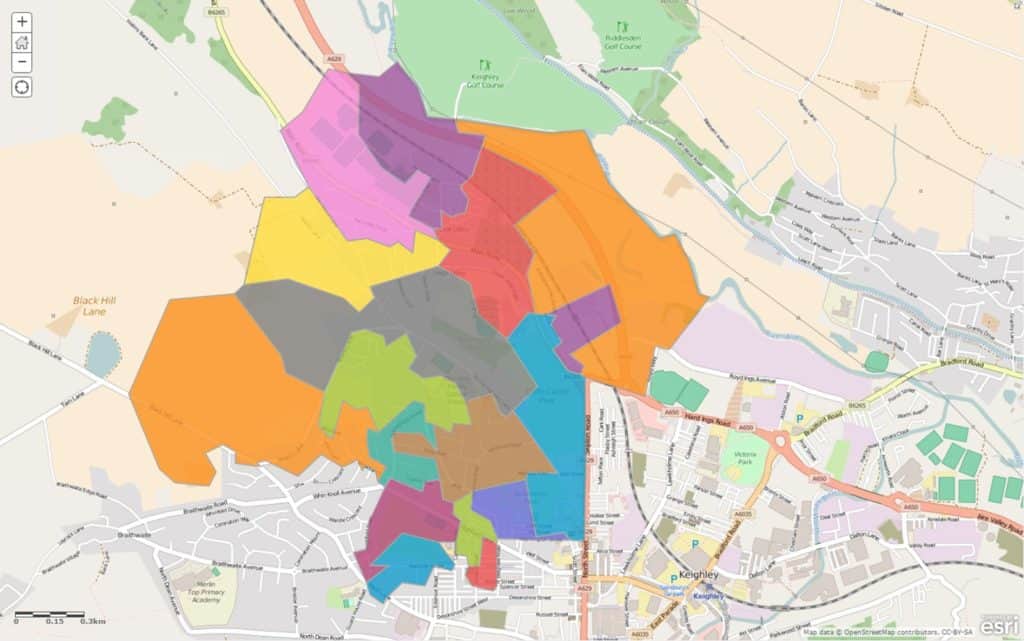
The focus of our enquiry will be to look at differences in quality of life within and between different areas. Use the IMD Data Explorer to choose the Lower Super Output Areas (LSOAs) you want to study.
Now identify the Output areas within each of the LSOAs. Output Areas contain roughly 40 – 125 households each, making an Output Area a manageable size for a single day’s data collection.
Measuring environmental quality
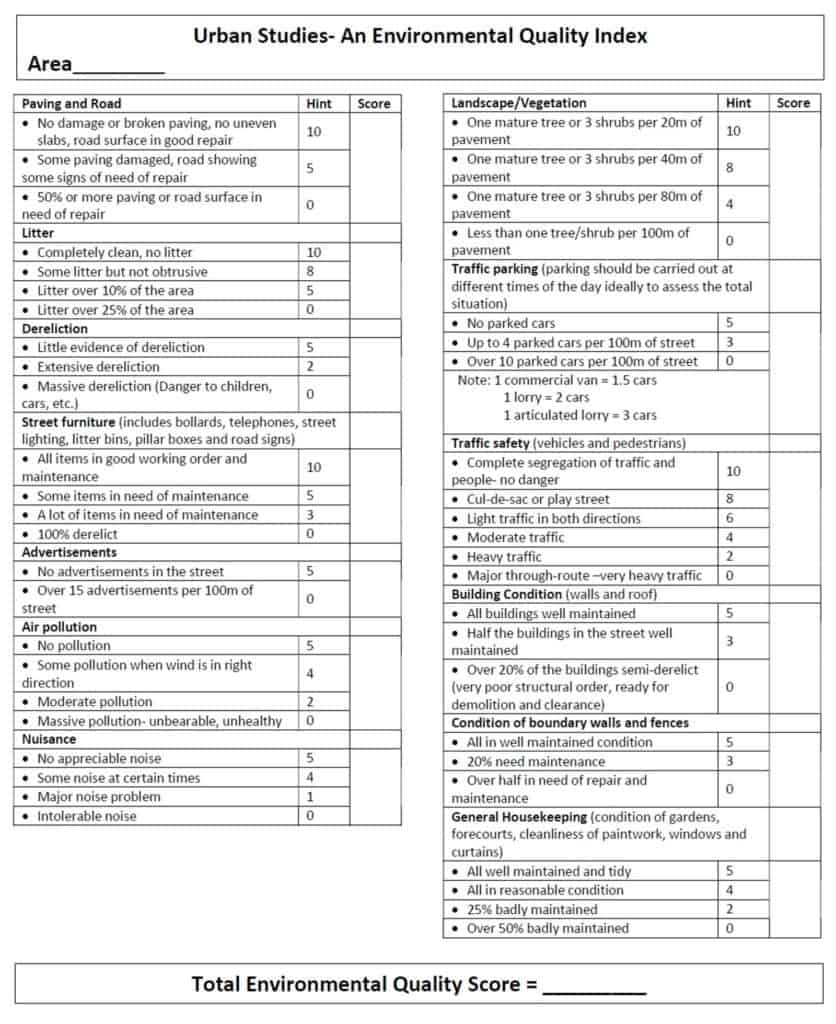
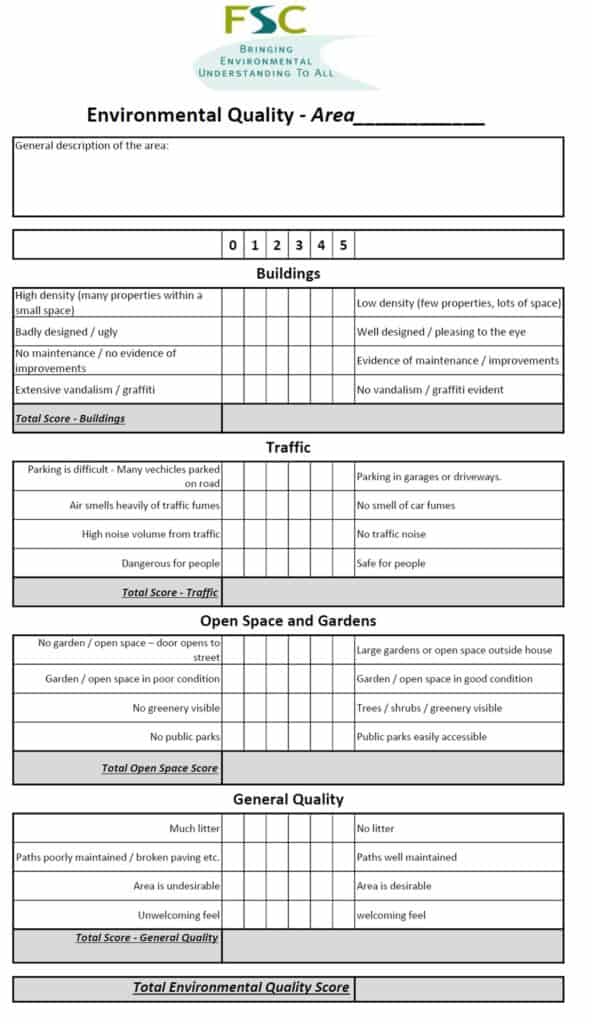
An environmental quality survey uses an observer’s judgements to assess environmental quality against a range of indicators. Often they work on a sliding scale of quality (like 1 to 5) to represent less good to good. Alternatively you can use a Bi-polar scale (like -5 to +5) to indicate a negative assessment through to a positive assessment, with 0 representing neither good or bad.
As it is based on personal judgements the data collected using environmental quality surveys is subjective. Benchmarking the scoring between different observers will help reduce this subjectivity.
Sampling for environmental quality surveys within a study:
- Either an overall judgement of an area – walk around the whole Output Area and then complete the survey as a summary
- Or at a number of points within the area – which may be selected using a random, systematic or stratified sample
Recording site location
The easiest way to accurately record the locations of your sampling sites is to use a GPS – there are many different Smartphone apps that will allow you to do this. If you want to use GIS to locate your sites on a map or to display your data, you need to record your location as latitude and longitude.
Qualitative methods
Data on perceptions of quality of life is almost impossible to quantify.
Questionnaires, with a mixture of open and closed questions addressing what people like about the area and what they don’t like about the area, can reveal some valuable insights. It can also be interesting to ask people where in the town or city they would most like to live and why? Questions like this will reveal not just people’s perceptions of their own area, but also of neighbouring areas. People tend to be either envious or wary of nearby areas and this can be quite revealing. Note that it is not always easy to ask questionnaires in residential areas, as willing respondents aren’t always easy to find.
You can also use annotated photos. Note the features that indicate high or low quality of life.
A simple way of gauging perceptions of a place is to use epitome words. Think of a single word that sums up that area. These can then be put into a word cloud (e.g. Mentimeter) and used to compare different areas.

Secondary and Further Education Courses
Set your students up for success with our secondary school trips and courses. Offering excellent first hand experiences for your students, all linked to the curriculum.
Group Leader and Teacher Training
Centre-based and digital courses for teachers