Sophisticated data analysis will help you spot patterns, trends and relationships in your results. Data analysis can be qualitative and/or quantitative, and may include statistical tests. An example of a statistical test is outlined below.
Quantitative analysis: Descriptive statistics
Some questionnaire responses can be analysed quantitatively, such as
- answers to closed questions (e.g. male/female)
- answers on a Likert scale
Descriptive statistics include measures of central tendency (mean, mode and median) and measures of dispersion (range, interquartile range and standard deviation).
Worked example
One question in a questionnaire asked people to express their opinions on a Likert scale as follows
| Statement: St James Street in Burnley is safe at 8pm. | Answers: Strongly Agree / Agree / Don’t know / Disagree / Strongly Disagree |
|---|---|
| Out of the 100 people asked, the answers were | Strongly Agree = 15 Agree = 31 Don’t know = 10 Disagree = 23 Strongly Disagree = 21 |
In summary 46% of respondents felt safe and 44% of respondents felt unsafe in St James Street at 8pm.
Quantitative analysis: Frequency analysis
Sometimes the responses to open questions can also be analysed quantitatively.
You can count how many times a particular word or theme is used. Alternatively you can classify each statement into positive and negative, or in some other way (such as economic, social and environmental).
Worked example
For example one open question in a questionnaire asked
Is St James Street in Burnley safe?
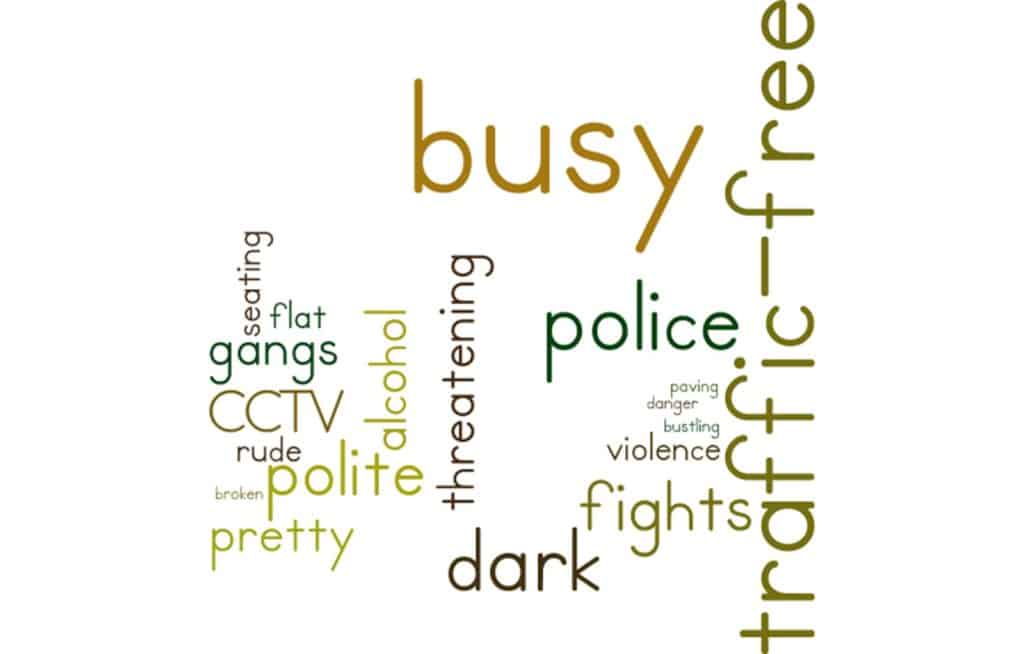
100 people were asked. 66 included statements which were positive (including traffic-free street, lots of passers-by, police presence, CCTV, wide and flat street). 68 included statements which were negative (poor streetlighting, late-night alcohol issues, perceived threat from groups of young people, uneven paving). In summary, 32% of responses were wholly positive, 34% of responses were wholly negative, and 34% of responses were a mixture of positive and negative.
Quantitative analysis: Chi-squared test
Chi squared in a statistical test that is used either to test whether there is a significant difference, goodness of fit or an association between observed and expected values.
\(\chi^2 = ∑ \frac{(O-E)^2}{E}\)
The chi squared test can only be used if
- the data are in the form of frequencies in a number of categories (i.e. nominal data)
- there are more than 20 observations in total
- the observations are independent: one observation does not affect another
There are 3 steps to take when using the chi squared test
Step 1. State the null hypothesis
There is no significant association between _______ and _______
Step 2. Calculate the chi squared statistic
\(\chi^2 = ∑ \frac{(O-E)^2}{E}\)
\(\chi^2\) = chi squared statistic
\(O\) = Observed values
\(E\) = Expected values
Step 3. Test the significance of the result
Compare your calculated value of \(\chi^2\) against the critical value for \(\chi^2\) at a confidence level of 95% / significance value of P = 0.05, and appropriate degrees of freedom.
\(\mathsf{Degrees\;of\;freedom = (number\;of\;rows\;– 1) \times (number\;of\;columns\;– 1)}\)
If Chi Squared is equal to or greater than the critical value REJECT the null hypothesis. There is a SIGNIFICANT difference between the observed and expected values.
If Chi Squared is less than the critical value, ACCEPT the null hypothesis. There is NO SIGNIFICANT difference between the observed and expected values.
Worked example
A Geography student is carrying out fieldwork on the lived experience of place in a town centre. The student has asked a convenience sample of shoppers to complete a questionnaire. Two of the questions are as follows:
| How far have you travelled from where you live? 0-2 miles / 2-5 miles / 5-10 miles / >10 miles |
| How often do you shop in this town centre? Daily / More than once a week / Once a week / Less often |
The student is interested in whether there is an association between the distance people travel and how often people visit.
Here are the results. Geographers call them the Observed Values.
| How often people visit | 0-2 miles | 2-5 miles | 5-10 miles | > 10 miles | SUM |
|---|---|---|---|---|---|
| Daily | 6 | 4 | 4 | 0 | 14 |
| More than once a week | 12 | 6 | 4 | 2 | 24 |
| Once a week | 10 | 10 | 8 | 2 | 30 |
| Less often | 6 | 13 | 5 | 8 | 32 |
| SUM | 34 | 33 | 21 | 12 | 100 |
Step 1. State the null hypothesis
There is no significant association between the distance people travel from their place of residence and how often people visit.
Step 2. Calculate the chi squared statistic
It is best to break this down into a number of smaller steps.
(a) Calculate the Expected Values using the formula
\(\mathsf{Expected\; value = \frac{row\; total\; \times \;column\; total}{grand\; total}
| How often people visit | 0-2 miles | 0-2 miles | 2-5 miles | 2-5 miles | 5-10 miles | 5-10 miles | > 10 miles | > 10 miles |
|---|---|---|---|---|---|---|---|---|
| O | E | O | E | O | E | 0 | E | |
| Daily | 6 | 4.76 | 4 | 4.62 | 4 | 2.94 | 0 | 1.68 |
| More than once a week | 12 | 8.16 | 6 | 7.92 | 4 | 5.04 | 2 | 2.88 |
| Once a week | 10 | 10.2 | 10 | 9.9 | 8 | 6.3 | 2 | 3.6 |
| Less often | 6 | 10.88 | 13 | 10.56 | 5 | 6.72 | 8 | 3.84 |
(b) Calculate [latex](O-E)\) and \((O-E)^2\) and \(\frac{(O-E)^2}{E}\)
Observed (\(O\)) and Expected (\(E\)) values have been copied from the table above.
| \(O\) | \(E\) | \((O-E)\) | \((O-E)^2\) | \(\frac{(O-E)^2}{E}\) |
|---|---|---|---|---|
| 6 | 4.76 | 1.24 | 1.54 | 0.32 |
| 12 | 8.16 | 3.84 | 14.75 | 1.81 |
| 10 | 10.2 | -0.2 | 0.04 | 0.00 |
| 6 | 10.88 | -4.88 | 23.81 | 2.19 |
| 4 | 4.62 | -0.62 | 0.38 | 0.08 |
| 6 | 7.92 | -1.92 | 3.69 | 0.47 |
| 10 | 9.9 | 0.1 | 0.01 | 0.00 |
| 13 | 10.56 | 2.44 | 5.95 | 0.56 |
| 4 | 2.94 | 1.06 | 1.12 | 0.38 |
| 4 | 5.04 | -1.04 | 1.08 | 0.21 |
| 8 | 6.3 | 1.7 | 2.89 | 0.46 |
| 5 | 6.72 | -1.72 | 2.96 | 0.44 |
| 0 | 1.68 | -1.68 | 2.82 | 1.68 |
| 2 | 2.88 | -0.88 | 0.77 | 0.27 |
| 2 | 3.6 | -1.6 | 2.56 | 0.71 |
| 8 | 3.84 | 4.16 | 17.31 | 4.51 |
| SUM | 14.1 |
(c) Find the sum of the \(\frac{(O-E)^2}{E}\) column
\(\chi^2 = ∑ \frac{(O-E)^2}{E}\)
\(\chi^2 = 0.32+1.81+0+2.19+0.08+0.47+0+0.56+0.38+0.21+0.46+0.44 +1.68+0.27+0.71+4.51\)
\(\chi^2= 14.1\)
Step 3. Test the significance of the result
Calculate degrees of freedom
\(\mathsf{Degrees\;of\;freedom = (number\;of\;rows\;– 1) \times (number\;of\;columns\;– 1)}\)
\(\mathsf{Degrees\;of\;freedom = (4–1) \times (number\;of\;columns\;– 1)}\)
In this example Degrees of freedom” = (4-1) \times (4-1) = 9[/latex]
Choose a significance level, e.g. p=0.05 This means that chance should only account for the results in up to 5% of occasions the field test is carried out.
Compare the result with the critical value in the table. If the calculated value is greater than the critical value in the table the null hypothesis must be rejected.
The critical value at p=0.05 for 3 degrees of freedom is 16.92
Since our calculated value of 14.1 > 16.92, the null hypothesis is not rejected.
There is no significant association between the distance people travel from their place of residence and how often people visit.
Qualitative analysis: Coding
Coding is an objective method for analysing passages of text, such as interview transcript, comments left in an online forum or written descriptions of a place in a tourist guidebook. There are two stages:
1. Descriptive codes: Read the text several times. Try to summarise each line with a single word or short phrase. This is called a label.
2. Analytic codes: Read your labels again. Try to group labels together into a few concepts.
Worked example
In 2010 the Wales Rural Observatory surveyed many farming households by telephone to find out more about plans for the future.
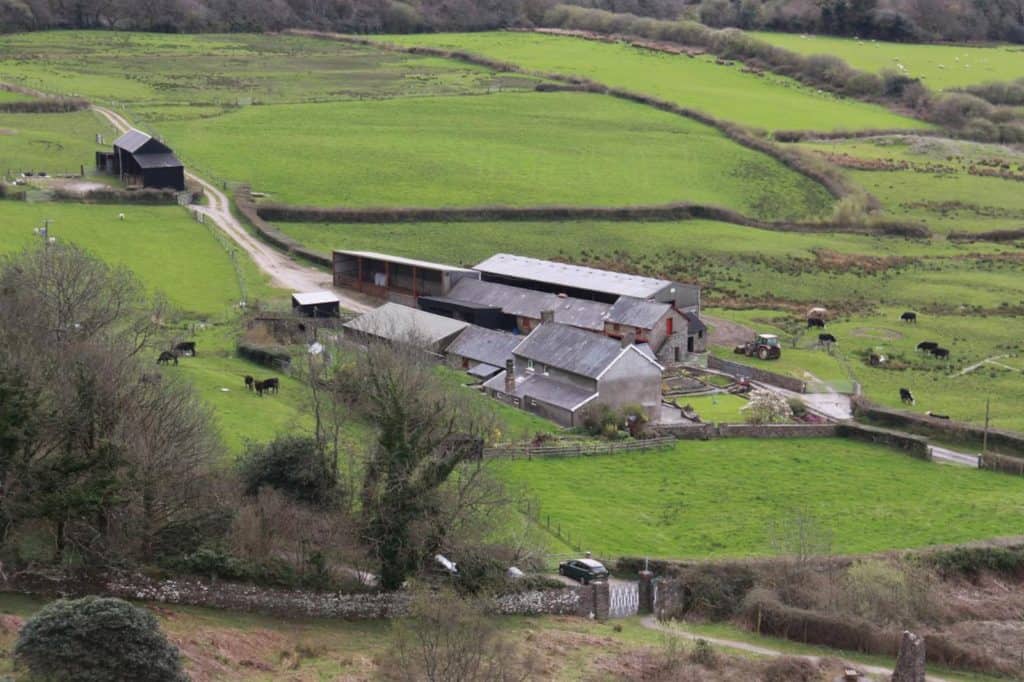
One open ended question was as follows.
“If input costs continue to rise, but farm gate prices fall, what will you do over the next 5 years?”
Each phone interview was recorded on tape, so that the interviewers could type an exact transcript. The transcripts were first analysed by descriptive coding. Each sentence was summarised with a label. Then they grouped the labels into a number of concepts, as follows:
| (a) Carry on business as usual |
| (b) Not sure what to do |
| (c) Take on or adapt to more environmental responsibilities |
| (d) Diversify |
| (e) Intensify the farm business |
| (f) De-intensify the farm |
| (g) Exit farming (retire / sell up) |
Frequency analysis was used to summarise the proportion of responses falling under each code. For example, 28% of responses were planning to carry on as usual, 22% were not sure what to do and 14% were planning to exit farming.
Qualitative analysis: Discourse analysis
Discourse analysis is a set of questions for analysing media, such as creative writing (like novels), photographs, television and film. It is a great way of finding out more about informal representations of place. Useful media sources might include:
1. English literature, such as selected passages from novels, e.g. descriptions of the Thames Estuary in the first chapter of Charles Dickens’ Great Expectations
2. Tourist brochures and other promotional materials (including websites)
3. Photographs used in promotional material, or a survey of photographs used on Flickr or Geograph for a particular place
4. Visual art (including paintings)
5. Television and film, such as the credits and opening shots used in regional dramas such as Emmerdale and Eastenders
For each piece of media, outline what you know about the:
(a) Author: who made the media (e.g. single author, a commercial organisation)? How and when was the media made? Who paid for the media to be made? Why was the media made (e.g. to sell to make a profit, to give out free to promote a particular place)?
(b) Audience: who is the intended audience (age/sex/ethnicity/socio-econonic group)? How will they engage with the media (e.g. go to the cinema, go to an art gallery, leave television on while they do other tasks like housework)?
Try not to guess; use as much evidence as you can. For example, why did Thomas Hardy write that particular novel? Why did John Constable paint that particular painting? (e.g. who commissioned the painting?) Why do people submit photos to Geograph or to Twitter (e.g. do they get rewards?)
Worked example
This example of street art can be found in Newton Street, Manchester.
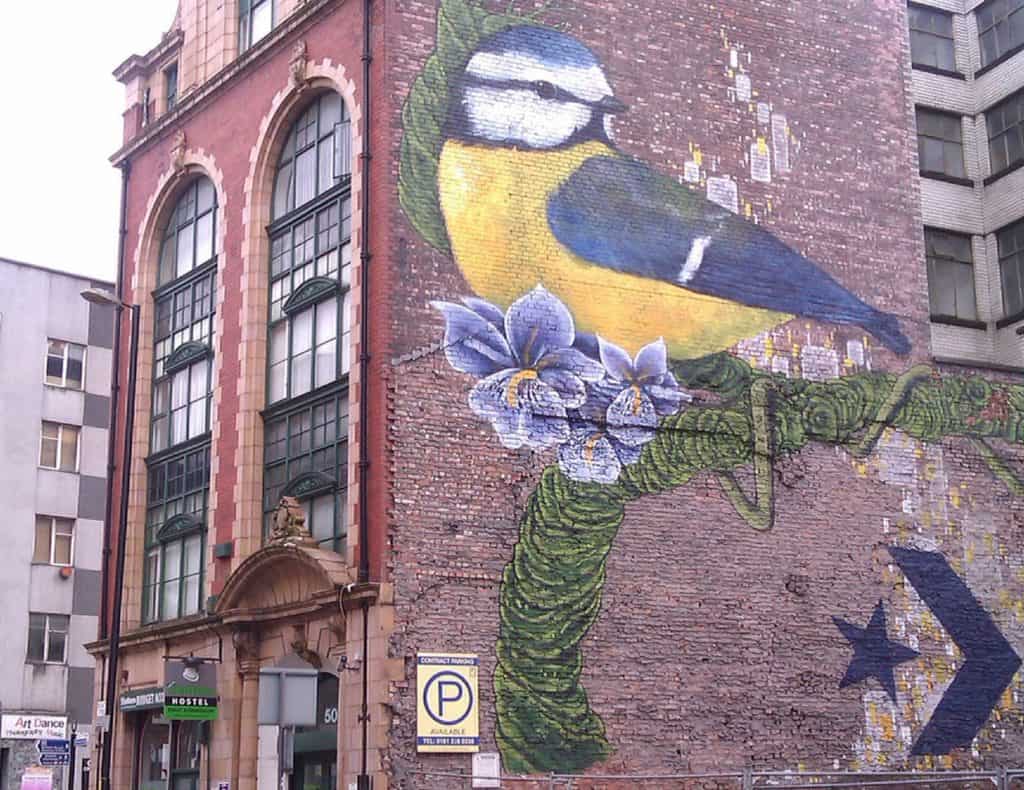
Can you use discourse analysis on this artwork?
(a) Author
- Who made the artwork? It was painted by “Faunagraphic”, a young female artist based in Sheffield
- When and how? Painted in 3 days in November 2011 with help from 2 assistants
- Who paid? It was commissioned by Converse, a footwear brand owned by Nike Corporation, with the agreement of the building’s owner
- Why? To promote Converse as a desirable fashion choice (“cool”, “edgy”) to young consumers, but also represent wildlife “reclaiming” old industrial buildings
(b) Audience
- Who? Passers-by, this is a busy street with high footfall within easy walking distance of shops, trains and trams
- How will they engage? People will observe the artwork as they walk by, and many people are likely to stop and take photographs (e.g. it is one of the more popular locations for “selfies” in Manchester Northern Quarter on Instagram). The image is large enough to be safely photographed from the other side of the road, with the Converse logo featuring in photographs
Qualitative analysis: Image analysis
This technique is adapted from A level Media Studies. It can be used for photographs, paintings and television/film. There are 4 stages:
1. Denotation – make a list of the main contents of the image
2. Connotation – explain what you think the image is trying to convey
3. Mise en scene (literally “placing on stage”) – look more closely for clues from the background and arrangement of the image. Include people’s clothing, hairstyles, pose and facial expressions, and details you can see in the background
4. Organisation – there are two parts to this:
(a) Composition – how are the people and objects arranged in the picture? Is one element larger, more central and better lit than another?
(b) Framing – this is where the image begins and ends. What angle is the image depicted from?
Worked example
Mr and Mrs Andrews was painted by Thomas Gainsborough in 1750. It shows a scene in Bulmer, north Essex.
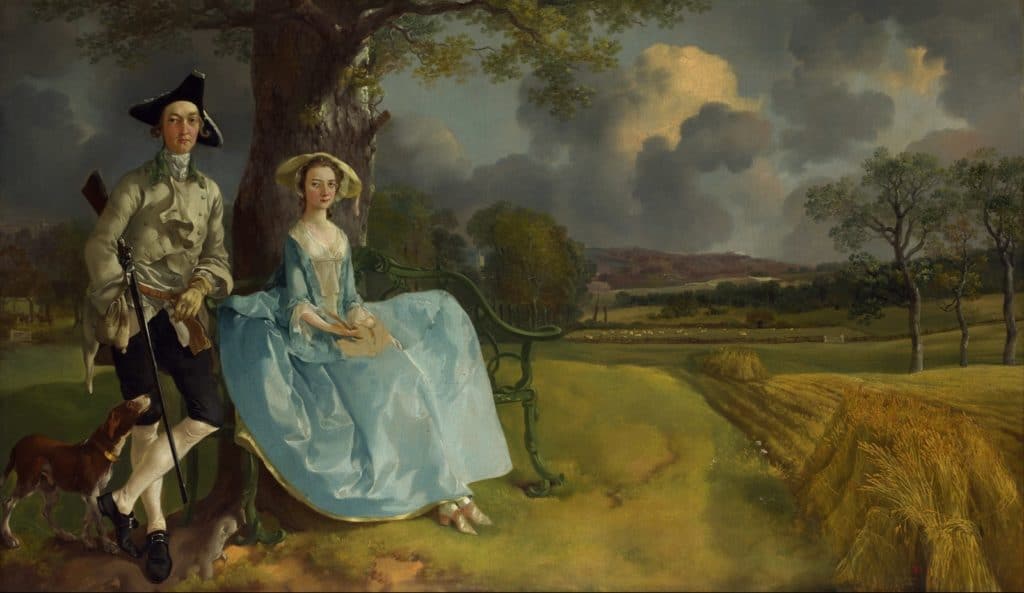
How does the image represent place? Can the image be analysed? Here are some ideas – but there are many more.
1. Denotation: man standing, woman seated on bench in front of mature tree. Farmed landscape with rows of corn and grazing sheep in the distance.
2. Connotation: suggests a young but rich married couple positioned close to farmland that they own but do not do the work themselves: probably landed gentry.
3. Mise en scene: the facial expressions (single raised eyebrow and staring eyes), the woman’s rigid upright pose and the man’s gun and dog suggest unfriendliness: the message is “private land – keep out!”. Their clothing is clean but impractical for farm labour – they are people of leisure. The man is dressed and equipped for hunting and shooting. The neat parallel rows of corn stretching into the distance, neat hedges and young trees suggest a well organised farm. None of the farmworkers are shown in the painting.
4. (a) Composition – the painting is arranged with the people in the foreground to the left as the focus of attention. However over half the painting is taken up with the landscape, with bundle of corn in the foreground stretching into fields in the distance.
4. (b) Framing – the people take up most of the height and almost half the width of the painting. They are not cropped. However the landscape, especially the rows of corn and the young trees have been cropped. It gives the impression that this is only a small part of a much larger farmed landscape.

Secondary and Further Education Courses
Set your students up for success with our secondary school trips and courses. Offering excellent first hand experiences for your students, all linked to the curriculum.
Group Leader and Teacher Training
Centre-based and digital courses for teachers