Quantitative methods
Sampling
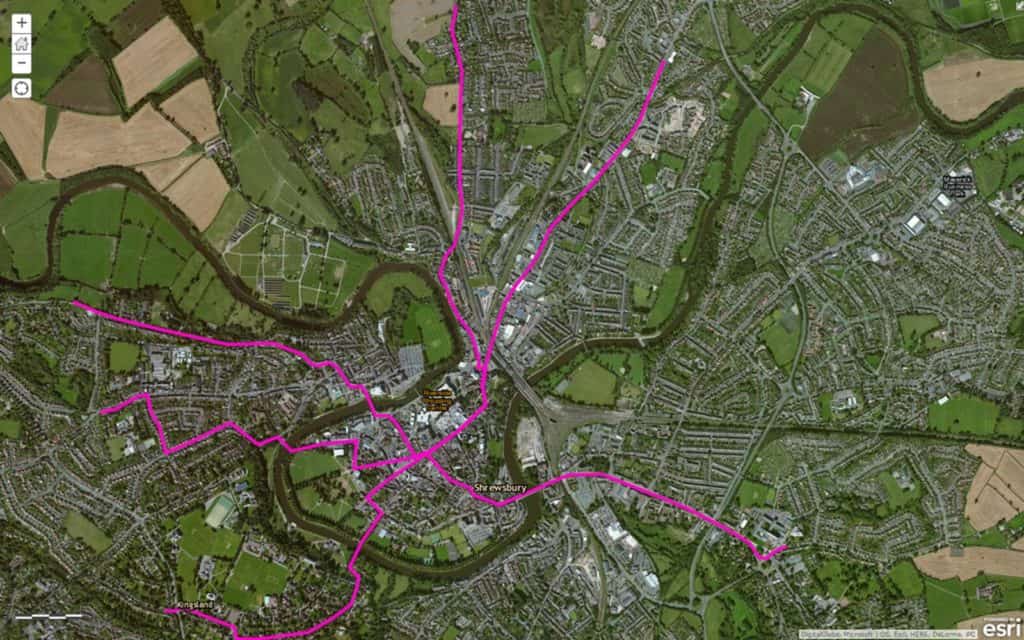
Questions focussing on spatial changes in land use might consider changes with distance from the centre of the CBD. This approach lends itself to a transect (i.e. a line along which data is collected).
Temporal changes might involve students looking at land use within a defined area, looking at individual buildings to record their current land use, and compare with historic land uses in order to identify and quantify change.
Measuring land use function
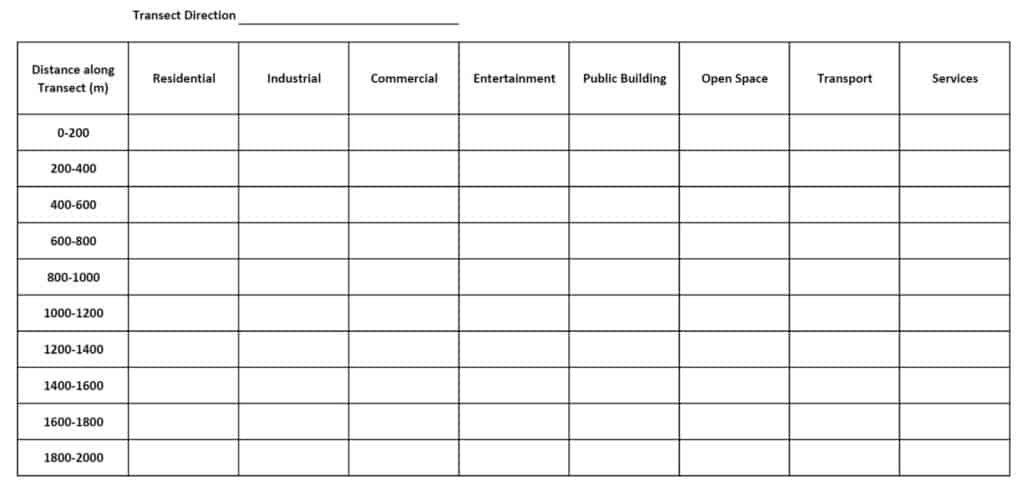
Along each of the transects use a systematic sampling strategy to select locations to record land use function. You may wish to restrict your sample as follows:
- recording land use every 10m
- recording ground floor land use only
- recording land use on a single side of the road
Land use is categorised for ease of analysis. A popular way of doing this is to use the RICEPOTS system.
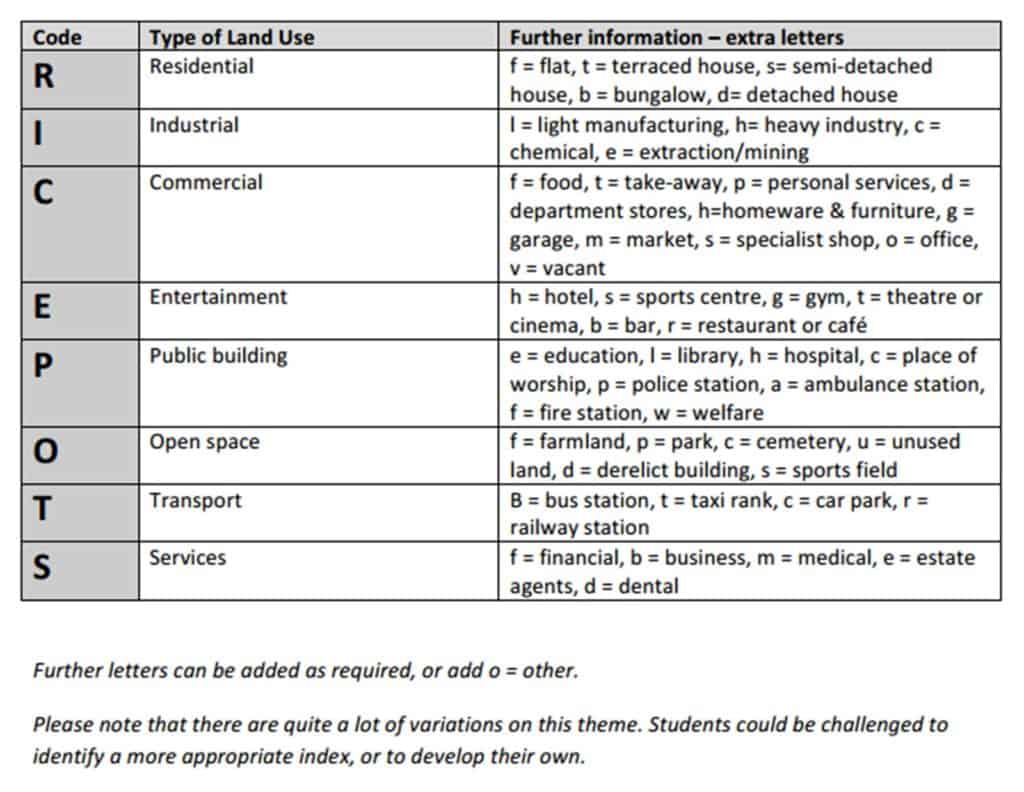
Construct a table to use in the field.
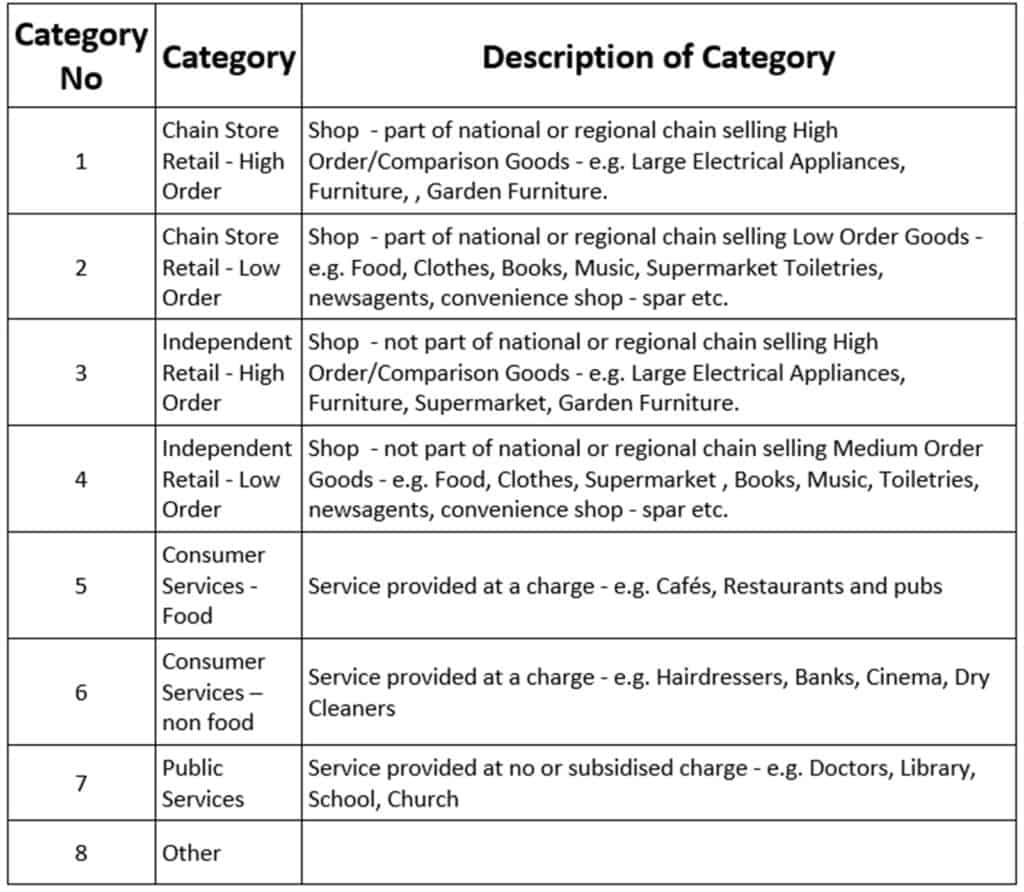
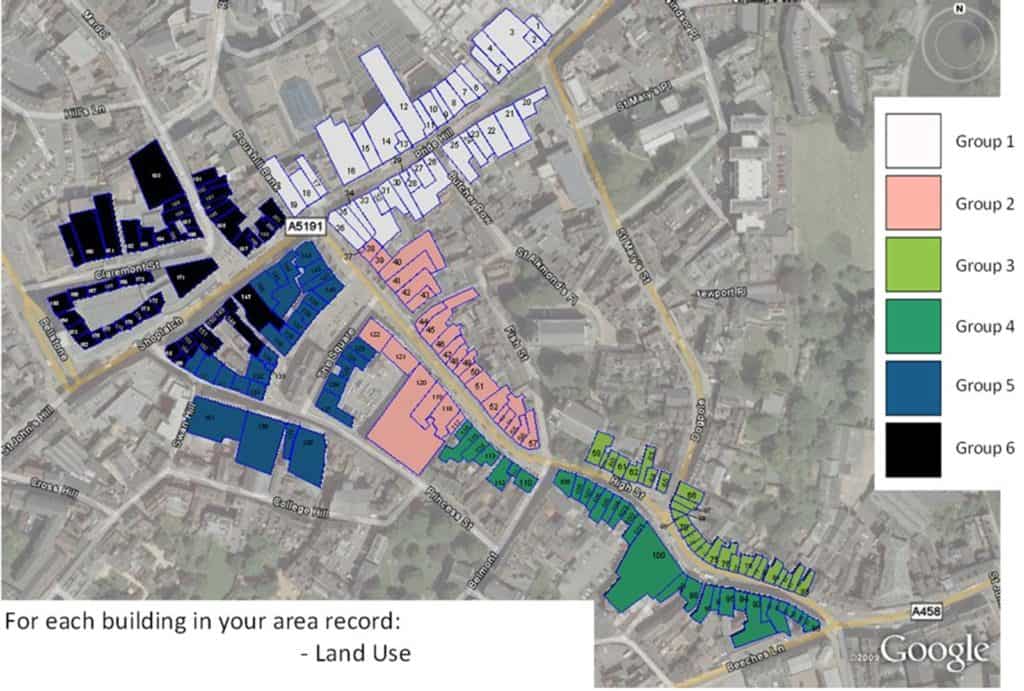
Alternatively you could record the land use for individual buildings – in this example the main shopping streets were identified from the town shopping website and these were used as the basis for the sampling strategy, recording land use of each building.
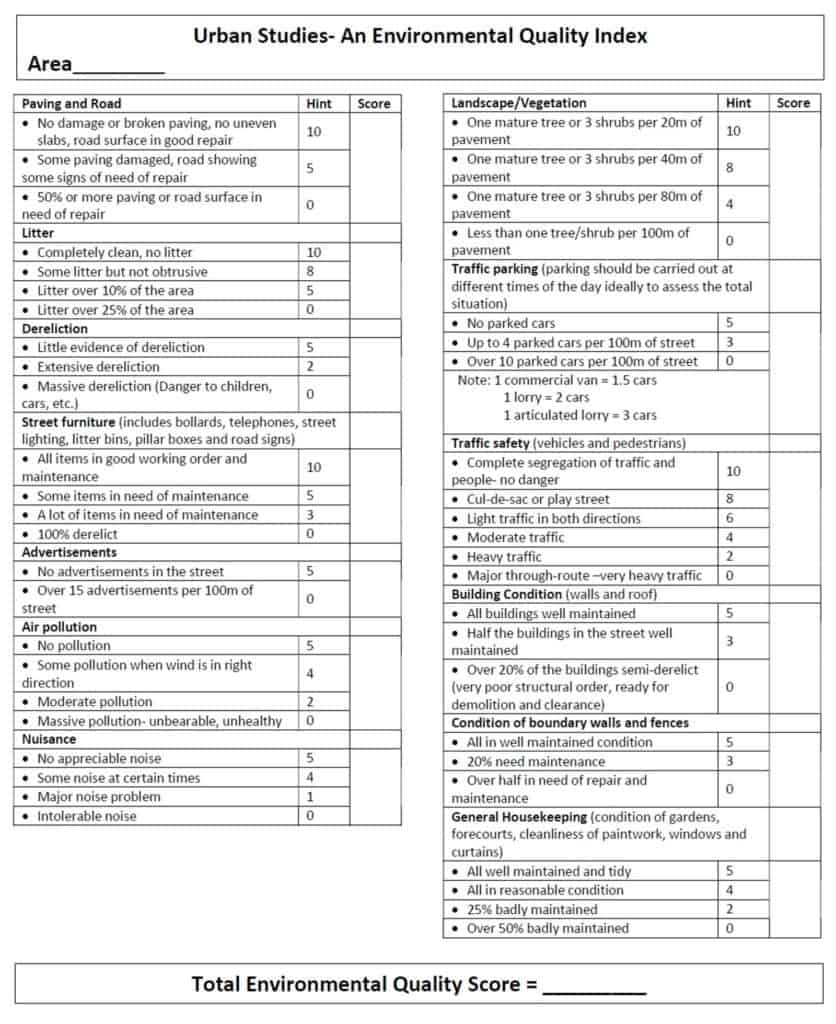
Recording the quality of the environment
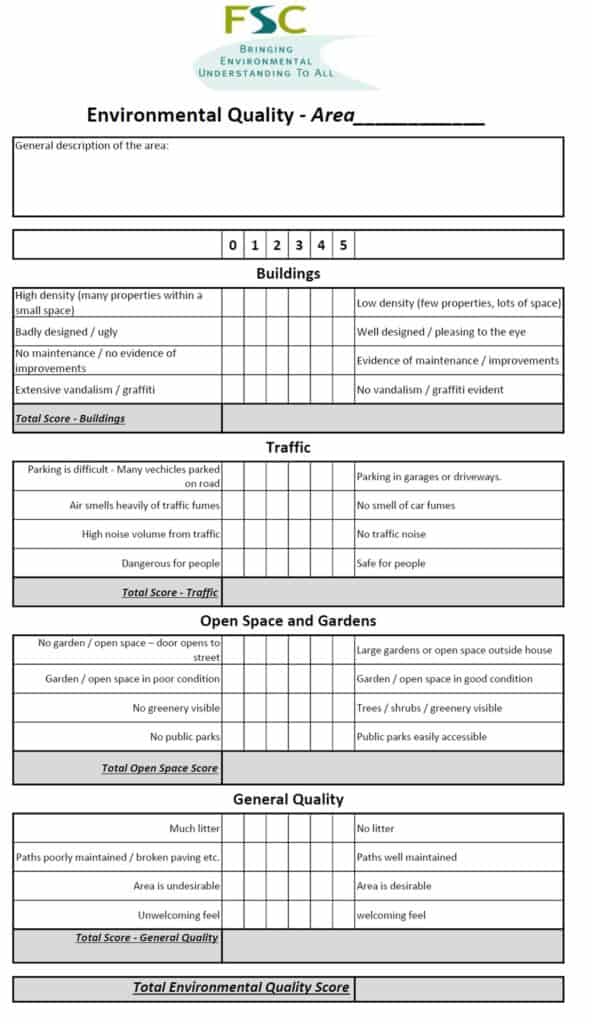
An environmental quality survey uses an observer’s judgements to assess environmental quality against a range of indicators. Often they work on a sliding scale of quality (like 1 to 5) to represent less good to good. Alternatively you can use a Bi-polar scale (like -5 to +5) to indicate a negative assessment through to a positive assessment, with 0 representing neither good or bad.
As it is based on personal judgements the data collected using environmental quality surveys is subjective. Benchmarking the scoring between different observers will help reduce this subjectivity.
Sampling for environmental quality surveys within a study like this could occur in several different ways:
- Transect – along the transects used for recording spatial changes in land use you could also complete an environmental quality survey every 200m, either a summary of the last 200m, or based on the immediate area.
- An overall judgement of an area – the shopping area is divided into zones: walk around the whole of a zone and then complete the survey as a summary of the whole of that zone.
- Locations chosen before fieldwork – before leaving for the fieldwork a number of survey points are chosen (selected using a random, systematic or stratified sample).
- Locations chosen during fieldwork – select representative locations to carry out the survey – these could be the worst place in that area, the best place in that area and an average place in that area.
Recording site location
The easiest way to accurately record the locations of your sampling sites is to use a GPS – there are many different Smartphone apps that will allow you to do this. If you want to use GIS to locate your sites on a map or to display your data, you need to record your location as latitude and longitude.
Qualitative methods
In addition to Environmental Quality surveys as described above which quantify the quality of the urban environment we can use a range of methods to collect information about environmental quality in a qualitative way.
Questionnaires
Questionnaires or informal chats with the public might ask the following
- “How long have you been shopping in the centre of <name of town>?”
- “How has the centre of <name of town> changed over that time?”
- “Which features of the shopping environment in <name of town> do you like/not like?”
- “Do you think the appearance of the town centre has changed over the time you have been shopping here?”
Annotated photographs and field sketches
Use annotated photos or field sketches to make a judgement about the quality of the environment. You could photograph at whole street scenes, or focus on small details such as a pile of rubbish. Alternatively construct a checklist of things to look out for, such as buildings, road and paving, litter, dereliction, street furniture, graffiti and fly posting.
Re-photography
Re-photography means that you look for old photographs and try to take a photograph of how exactly the same place looks today. Compare and contrast the two scenes. You could us the same technique to compare how a place changes over different days of the week or at different times of day.
Epitome words
A simple way of gauging perceptions of a place is to use epitome words. Think of a single word that sums up that area. These can then be put into a word cloud generator (e.g. Mentimeter) and used to compare different areas.
Secondary and Further Education Courses
Set your students up for success with our secondary school trips and courses. Offering excellent first hand experiences for your students, all linked to the curriculum.
Group Leader and Teacher Training
Centre-based and digital courses for teachers
Experiences for Young People
Do you enjoy the natural world and being outdoors? Opportunities for Young People aged 16-25.