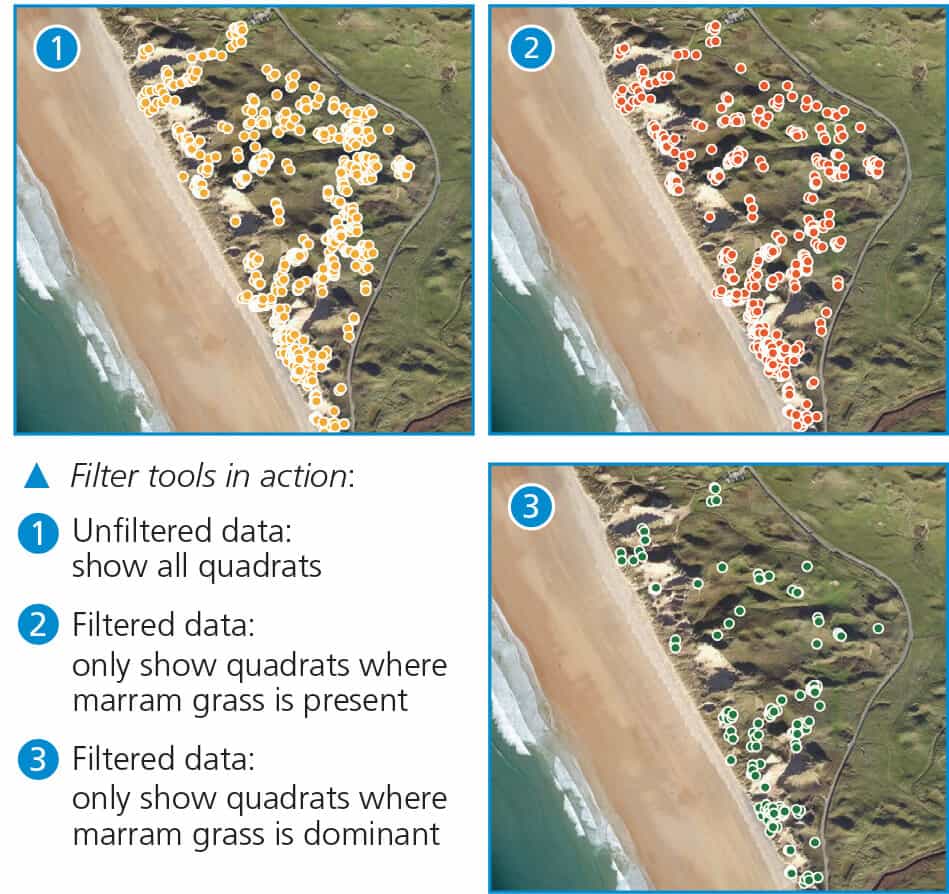
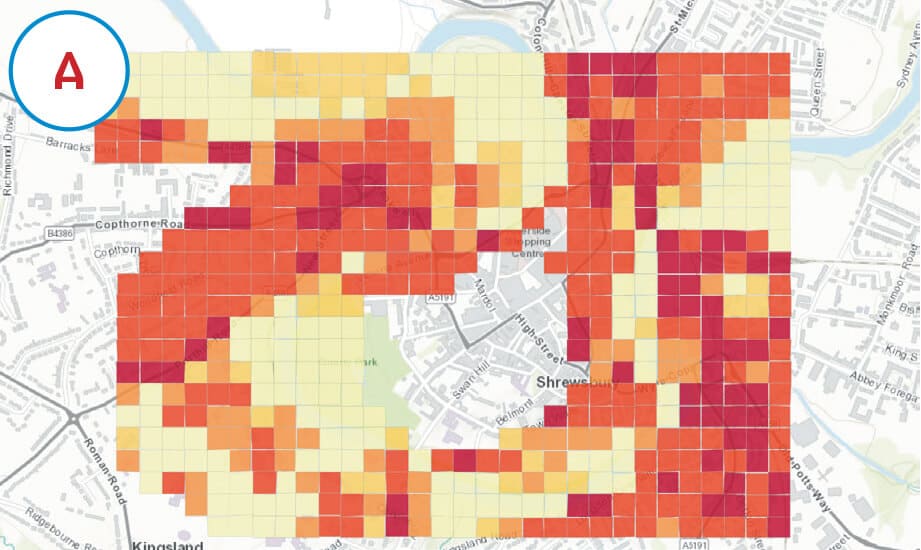
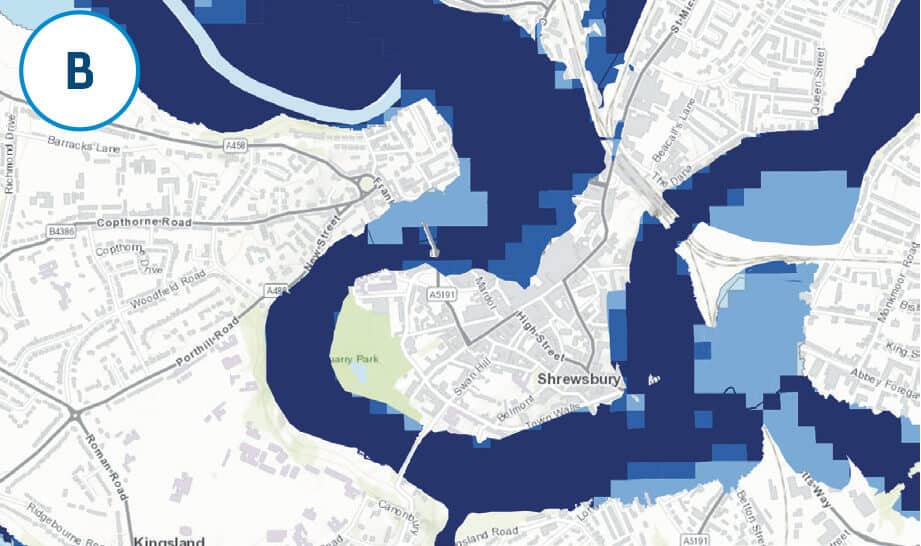
When drawing conclusions, you will need to look for links between different sets of results. This means looking at primary and secondary evidence together. GIS makes this much easier, allowing you to overlay data sets onto the same base map and explore relationships within and between the different layers.
Analysis tools can be used to explore links between data sets and identify anomalous results.
Filter or Select by Attribute tools can help confirm the presence of patterns you may have noticed from your data presentation, e.g.
- Show all locations where infiltration rate was above 150mm/hour.
- Show location of all shoppers who were male.
- Show the origin of all visitors visiting for over one day.
- Show only trees containing greater than one tonne of Carbon.
Or you can ask questions about multiple attributes at one location, e.g.
- Show areas where the environmental impact is greater than the economic impact.
- Show all locations where soil texture was clay AND infiltration rate was greater than 50mm/hour.

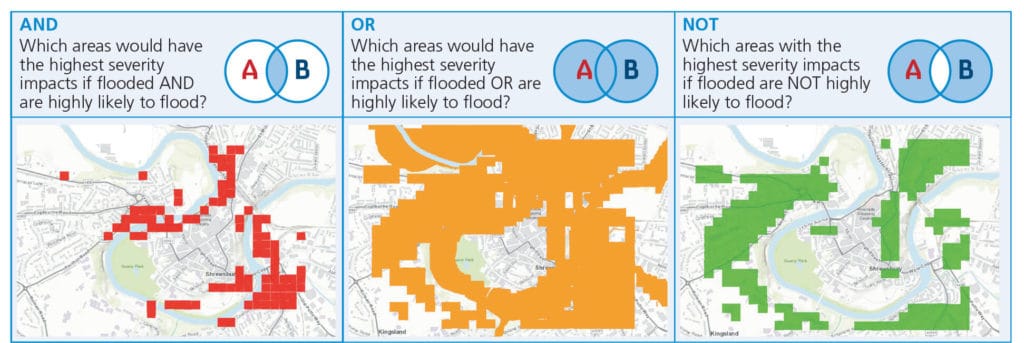
Find, Derive or Overlay functions apply logic arguments (like the ones used by filter) across two layers, or spatial selections indicating coincidence (or exclusivity) of features from two layers.
These tools use Boolean logic, OR, NOT, AND to identify which features to include (or exclude) in the resultant layer.


For more information on the analysis tools in ArcGIS Online see the ArcGIS Online help pages.

Secondary and Further Education Courses
Set your students up for success with our secondary school trips and courses. Offering excellent first hand experiences for your students, all linked to the curriculum.
Group Leader and Teacher Training
Centre-based and digital courses for teachers
Experiences for Young People
Do you enjoy the natural world and being outdoors? Opportunities for Young People aged 16-25.
