Critically evaluating the accuracy, validity and reliability of your methods and conclusions is a demanding geographical skill. But GIS can help!
By overlaying different data sources onto the same base map, such as primary data you have collected with published secondary data, you can easily compare the two sources.
When evaluating your methods of data collection and resultant conclusions it can be useful to consider the topic of your investigation more widely, again, working spatially can help with this. Re-visit some of the sources you looked at in your contextualising research, or others that you have identified through your work.
- How do data you have collected compare with existing data sets for that area?
- To what extent do the two match?
- To what extent are the two different?
- Why might there be differences? Could the time of day, day of week, or time of year have led to systematic errors in your data?
- How do your anomalies compare against a bigger (longer term or wider area) data set? If you look at them in the bigger picture are they still anomalous?
Worked example
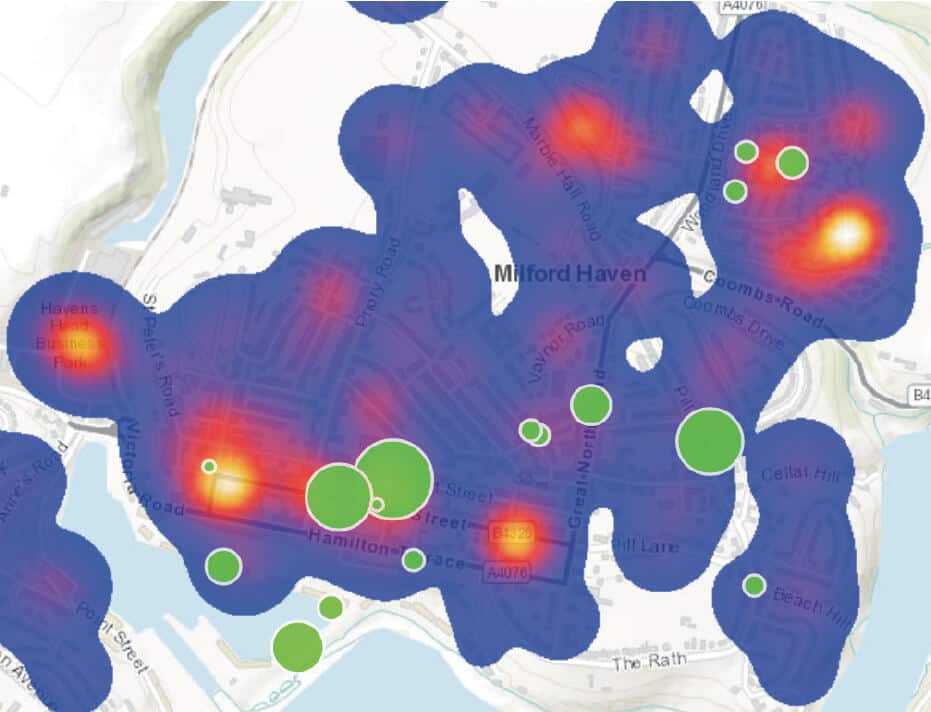
A geography student has collected data on crime rates in Milford Haven. Her primary data (shown by the green circles) show how many anti-crime features were observed in a field survey (e.g. window shutters, burglar alarms). Secondary data show crime rates recorded by the police (purple is low, red is intermediate, white is high).
There is not a perfect match between field observations of anti-crime features and secondary data from police records. At least four locations with high published crime rates (e.g. Havens Head Business Park) have no observed anti-crime features.
However, even if your primary data does not match the secondary data, it does not automatically mean that theprimary data is ‘wrong’.
- Do the two data sources actually measure the same thing?
- How old is the secondary data set?
- Could the situation have changed since it was collected?
In this example, the two maps do not actually measure the same thing. The anti-crime feautures were aimed at one sort of crime: burglary. But the published crime data covers a wider range of crimes, such as anti-social behaviour, assault and car theft.

Secondary and Further Education Courses
Set your students up for success with our secondary school trips and courses. Offering excellent first hand experiences for your students, all linked to the curriculum.
Group Leader and Teacher Training
Centre-based and digital courses for teachers