Good fieldwork data collection is well planned. The special feature of GIS is that each piece of data is tied to a particular location. So GIS can help you plan both where you will collect data and how you will collect data. To get the most of out GIS, there are a few technical terms that it is useful to know.
Fieldwork involves collecting data, including:
- measurements
- observations
- recordings
In GIS, a piece of data is called an attribute. There are four possible types of attribute: integer, float, string and date. Choosing the right attribute type is important as the wrong choice can make it harder to map your data correctly in GIS.
| What data you collect | What does the data look like? (called the data format) | GIS calls this |
|---|---|---|
| A count of the number of houses within an area. An environmental quality survey score. | A whole number | Integer (or Short or Long) |
| The length of a pebble on a beach | A number with a decimal point (GIS might allow you to define the number of decimal places) | Float (or Double or Decimal or Real) |
| Answers to a question within a questionnaire – “Where have you come from?” A description of your mood. | A set of characters of any type in any order – Text or text and numbers | String (or Text) |
| 1st May 1982 30th January 2017, 15:55:54 | A date and/or time | Date |
In GIS each piece of data (e.g. measurement, observation or recording) has a location. There are three possible types of location: point, line and polygon. Which you use will depend on the features you are describing, and the coarseness of the scale you are working. Your data collection might use a combination of points, lines and polygons.
| Point | A single location | Locations of individual trees |
| Line | Several linked points in a known order | Route taken through a town for a dérive |
| Polygon | Several linked points in a known order to form a closed shape | Area of uniform land use or a census output area |
So in summary, you will need to make some decisions about your data collection.
- What data to collect (what attributes?)
- How to record that data (what attribute types?)
- How to record locations (what location types and location format?)
As well as deciding what type of location to use, you will need to decide on the most appropriate format to define them.
Examples of using GIS to plan data collection
(a) Beach sediment
Sampling locations for pebble measurements have been chosen on map in the classroom, you need to navigate to each sampling point to collect data.
| Location Type | What location format? | Considerations |
| Point | Latitude and Longitude or Ordnance Survey grid reference | Use GPS app or appropriate map to navigate to location. You will need to convert OS grid references to Lat/Long for most GIS – Convert at doogal.co.uk Batch Reverse Geocoding |
(b) Glacial striations
Record the location and orientation of striations identified in the field.
| Location Type | What location format? | Considerations |
| Point | Latitude and Longitude or Ordnance Survey Grid Reference | Use GPS app or appropriate map to identify current location. You will need to convert OS grid references to Lat/Long for most GIS – Convert at doogal.co.uk Batch Reverse Geocoding |
(c) Questionnaires
Recording and mapping visitor response to “Where have you come from?” question.
| Location Type | What location format? | Considerations |
| Point | Full Postcode, e.g. SY4 1HW | Less error prone than asking for name of place. Some GIS can use or you can convert to Lat/Long online at doogal.co.uk Batch Geocoding |
(d) Footpath erosion
Mapping severity of footpath damage within a sensitive area.
| Location Type | What location format? | Considerations |
| Lines | Latitude and Longitude or Ordnance Survey Grid Reference | Record as a series of individual points; make sure you know the order. |
(e) Land use
Mapping land use.
| Location Type | What location format? | Considerations |
| Areas | Latitude and Longitude or Ordnance Survey Grid Reference | Record as a series of individual points; make sure you know the order. For areas ensure points form a closed loop. |
(f) Environmental quality
Assessing environmental quality as part of a study of deprivation.
| Location Type | What location format? | Considerations |
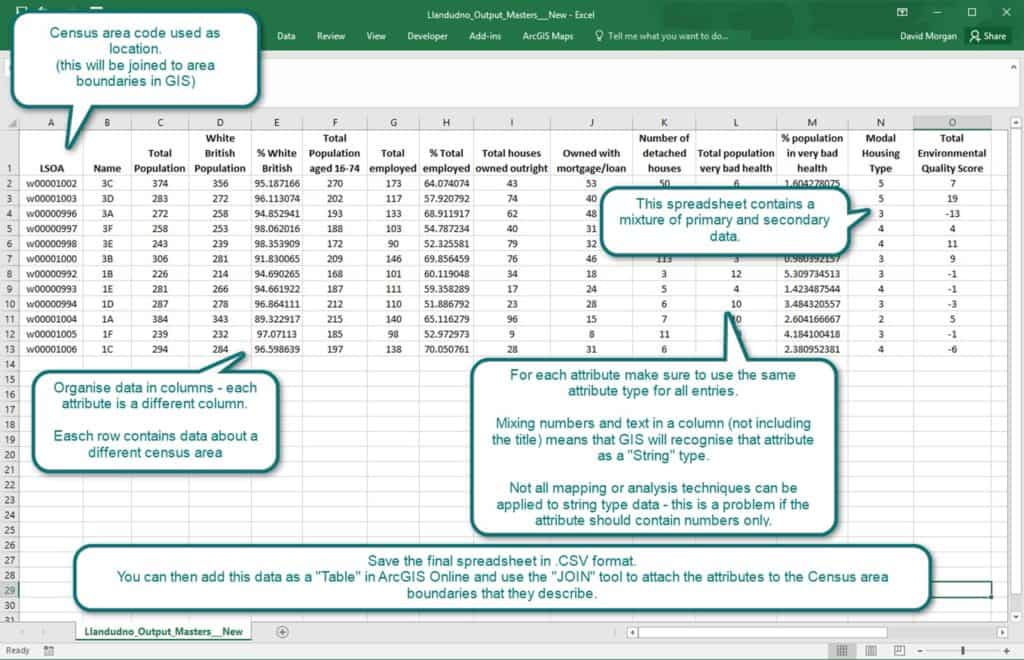
| Areas | Census Output Area (or Super Output Area) | Identify Census areas to be studied in advance (using secondary data). Ensure you have a map showing area boundaries. |
Adding data
Recording location could be done by noting down the latitude and longitude of every point where you collect data, storing locations in a GPS device or using existing boundaries (such as census output areas) to define your sampling areas.
By creating a spreadsheet containing your located data you can add your field data to a map in ArcGIS Online.
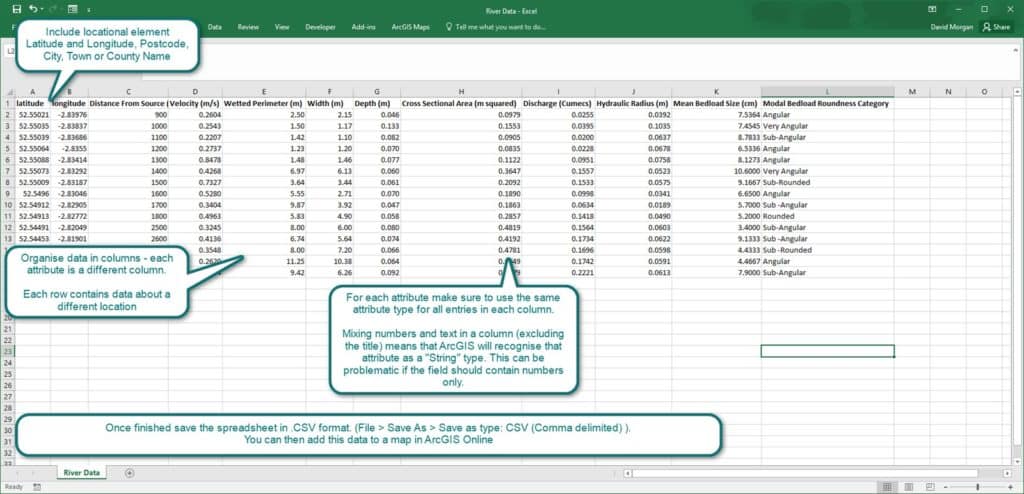
Adding a spreadsheet containing point data to ArcGIS Online can be done in three different ways.
Creating a spreadsheet to add Census area data to a map.
With ArcGIS Online, you can use the Survey 123 app to collect your data directly onto a map. Survey 123 is available for Android, iOS and Windows, and allows you to collect spatial data quickly and simply.
Full examples
(a) Questionnaire
A questionnaire used as part of an investigation into the sphere of influence of a seaside town might include
| Question | Location or Attribute | Type | Recording Data |
| Where have you come from? | Location | Point | Record full postcode |
| How did you get here? | Attribute | Text | Closed question, choose from list |
| Why have you chosen to visit Tenby? | Attribute | Text | Open question, record full response |
| When did you arrive? | Attribute | Date | Record arrival date |
| How long did it take you to get here? | Attribute | Float | Record travel time in hours (or parts of). E.g. 3.5 hours |
| How long are you going to stay? | Attribute | Integer | Record number of days. E.g. 1 day |
(b) Field survey in hydrology
A student investigating infiltration rates in contrasting areas of a catchment might record the following.
| Observations or Measurements | Location or Attribute | Type | Recording Data |
|---|---|---|---|
| Location of measurement | Location | Point | Latitude and longitude |
| Infiltration rate (mm/hour) | Attribute | Float | Calculated from infiltration tube measurements |
| Soil Texture | Attribute | Text | From soil texture test |
| Soil Depth | Attribute | Integer | Soil Depth (mm) |
| Gradient | Attribute | Integer | Measured with clinometer |
Finding secondary data sets
Many organisations responsible for the collection and distribution of data use Geographical Information Services on their websites to allow public access to their data. These GIS Services let you explore the data provided by that organisation. It may also be possible to download data for use in GIS packages.
Rivers and flooding (river and sea)
Check My Flood Risk – Flood risk map – England – Uses Environment Agency Data
National Resources Wales – Flood risk map – Wales
Scottish Environmental Protection Agency – Flood risk map – Scotland
Flood Maps NI – Flood Hazard & Flood Risk Maps for NI
Gauge Map – River level monitoring and rainfall gauges – UK
National River Flow Archive – River gauging stations, long term flow data and catchment spatial data
Population statistics
DataShine Census – 2011 Census data mapped – England and Wales
DataShine Scotland – 2011 Census data mapped – Scotland
Index of Multiple Deprivation 2015 Explorer – England
Indices of Deprivation for UK Countries – Interactive maps of deprivation in England (2015), Scotland (2016) and Wales (2014)
ONS 2011 Census Data – The starting point for access to 2011 Census data by release and in all available formats
Police.uk – Crime map – Explore and compare crime and outcomes of crime in England, Wales and Northern Ireland
Soil and geology
UK Soil Observatory Soils Map Viewer – over 100 map layers contributed by a range of providers, covering topics such as soil carbon content, moisture, texture, and land cover
Soilscapes Soil Type Viewer – 1:250,000 scale, simplified soils data set covering England and Wales
British Geological Survey Geology of Britain Viewer – combines a number of key British Geological Survey data sets in a single viewer
Changing landscapes
Old Maps Online – Access historic maps
BritIce – A “glacial map” recording land forms and evidence resulting from the last British Ice Sheet
National Trust Mapping Our Shores – Coastal land use maps from 1965 and 2014 covering England Wales and Northern Ireland
Windy – Forecast and monitoring maps for a range of factors including wind, waves and precipitation
National environment agencies
MAGIC– The MAGIC website provides authoritative geographic information about the natural environment from across government in England, Scotland and Wales
Natural Resources Wales Interactive Maps – NRW interactive maps give easy access to environmental data sets in Wales
Scotland’s Environment Web – Map – View any combination of different environmental map layers, published by a range of Scottish organisations and agencies.
ESRI Living Atlas and ArcGIS Online
The ESRI Living Atlas brings many secondary data sets into one place.
Through the living atlas you can access a (growing) selection of secondary data, adding data from different sources onto one map in the ArcGIS Online Map Viewer – this is particularly useful if you are looking to compare data from several different sources.
Try searching the Living Atlas for;
- Index of Multiple Deprivation
- UK Census
- Flooding
- CORINE Land Cover
You can also search ArcGIS Online for data created by others and shared publicly. Be aware that these layers are not quality controlled, so consider the source and quality of any data sets you use.
If you have downloaded data from elsewhere you might be able to add it to the ArcGIS Online Map Viewer – Compatible formats include .CSV File, Shapefile and .GPX File. There are three main ways of adding data from your computer to the Map Viewer.
The quickest and simplest way of adding data from a spreadsheet is via the “drag and drop” – this only works with data saved in .CSV file format, and gives limited functionality in ArcGIS Online.
Adding data via the map viewer – this will work with data in .CSV File, Shapefile and .GPX file format, and gives limited functionality in ArcGIS Online.
Adding data via Content – this will work with data in .CSV File, Shapefile and .GPX file format, and gives full functionality in ArcGIS Online.

Secondary and Further Education Courses
Set your students up for success with our secondary school trips and courses. Offering excellent first hand experiences for your students, all linked to the curriculum.
Group Leader and Teacher Training
Centre-based and digital courses for teachers