All Geography starts with someone going into the field to find out what’s there. This section will help you to gather the primary data (data you collect yourself) and secondary data (data collected by someone else) that will support your analysis and conclusions.
| Type of data | Primary data collection technique | Secondary data collection source |
|---|---|---|
| Causes of flooding | Storm simulations | Weather data Drainage basin characteristics Historical river levels |
| Flood management | River management score Bi-polar analysis Questionnaires Interviews Oral histories | Historical river levels Flood management |
| Risk and vulnerability | Risk mapping | People’s experiences of flooding |
| People’s experiences of flooding | Interviews Oral histories | People’s experiences of flooding |
Causes of flooding
1. Storm simulations
This is one area of Geography where you can carry out a scientific experiment. If you can get hold of some basic materials, you can easily build a model drainage basin. For this to be successful, you do need access to an area of open ground (such as a grassy field), with permission to carry out some ground disturbance, such as lifting turf and digging soil. It is not a project to carry out on someone’s prized lawn or flower beds.
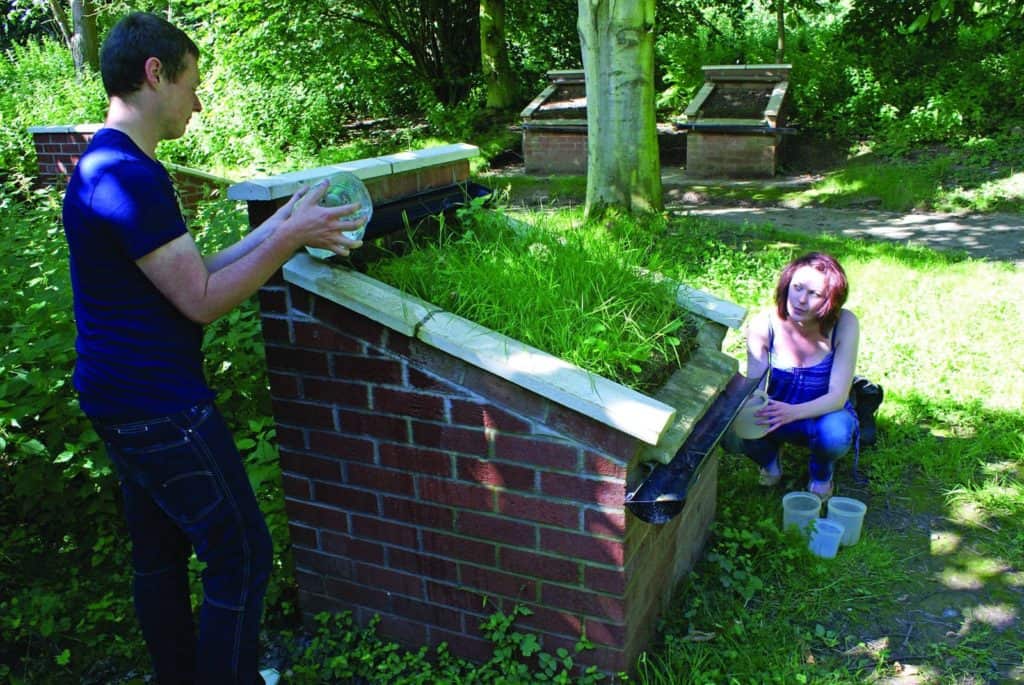
A model drainage basin (called a storm simulation plot) can be used as an open-air laboratory to test the link between rainfall and runoff. From your results, you should be able to draw storm hydrographs for a range of different ground surfaces.
Step 1. Building a storm simulation plot
It is helpful to choose an area of slightly sloping ground for the plot.
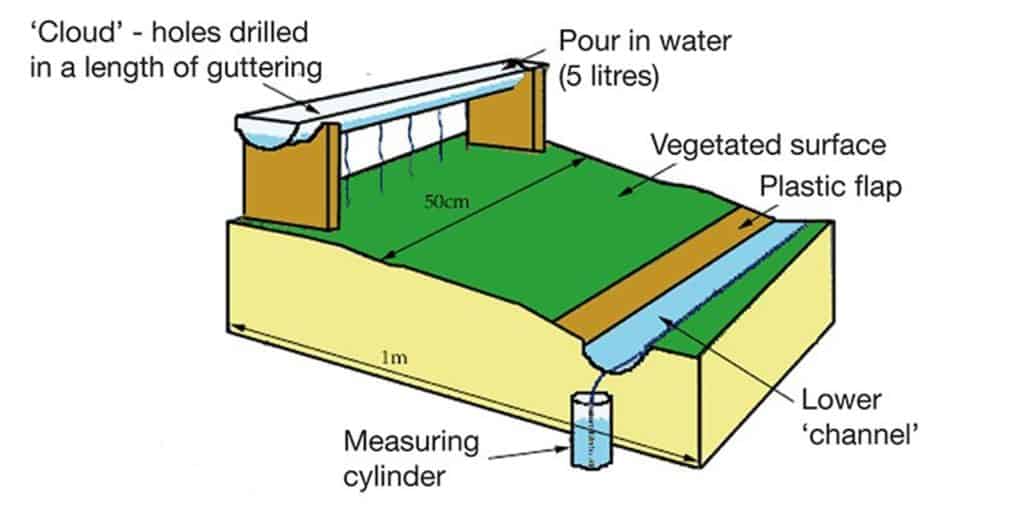
The diagram shows how a storm simulation plot could be constructed. You need the following materials
- two 50cm lengths of plastic guttering sealed at both ends (available from DIY shops)
- two blocks of wood of the same height – the exact height is not important, but they need to be high enough to hold the guttering off the ground (approx. 20cm in height will do).
- a polythene sheet large enough to cover whole plot when laid out flat (at least 1m x 50cm in area)
The first stage is to prepare one of the lengths of guttering to be your ‘cloud’. At roughly equal intervals along its length, drill five holes of the same diameter in the lowest point of the curved base of the guttering. The other length of guttering is your ‘river channel’. Remove the seal from one of the ends.
The blocks of wood are going to be used to hold up the length of guttering with the drilled holes (the ‘cloud’). They will need to be sawn into shape so that the guttering will remain in place (see diagram).
Now clear any grass or other vegetation from the land where you are going to build each plot. Lay the polythene sheet so that it covers the ground. You should aim to produce a shallow gradient of around 5-10 degrees from the top of the plot to the base. If the underlying ground surface is flat, use soil and turf under the polythene to lift it up at the ‘cloud’ end.
Fix the wood blocks at one end of the plot (ideally the uphill end). Place the guttering with the drilled holes (the ‘cloud’) on the wooden blocks. Place the second piece of guttering (the ‘river channel’) at the other end of the slope. Use waterproof duct tape or similar to ensure that there is a tight seal between the polythene sheet and the ‘river channel’.
Step 2. Preparing the ground surface of the plot
If you have been following these instructions up to now, you should have a plot covered in a polythene sheet. To simulate different ground surfaces (e.g. tarmac, grassland, ploughed farmland, etc.) you need to place different surfaces on top of the polythene. For each surface, follow the instructions in section (iii) to collect data.
If you are short of materials and/or space, you could use the same single plot for testing two or more ground surfaces. Alternatively, you could build more than one plot, although you will need to control variables such as slope angle.
Here are some suggestions for how you can simulate different ground surfaces. For an urban surface, such as tarmac, where you are aiming to make the ground surface as impermeable as possible, use the polythene sheet on its own. For a grassland surface, dig squares of undisturbed turf from nearby, and place these on top of the polythene. For a ploughed field surface, dig soil and spread this over the polythene.
Step 3. Running the storm simulation and collecting data
You will need
- a stopwatch
- a measuring cylinder
- a plastic jug containing 5 litres of water
- at least 2 people – 1 to pour water into the ‘cloud’, another to operate the stopwatch and read the measuring cylinder
One person pours a set amount of water from a plastic jug into the top guttering (the ‘cloud’). Try to pour water at a steady rate, and to pour along the whole length of the cloud. Start the stopwatch as soon as pouring starts.
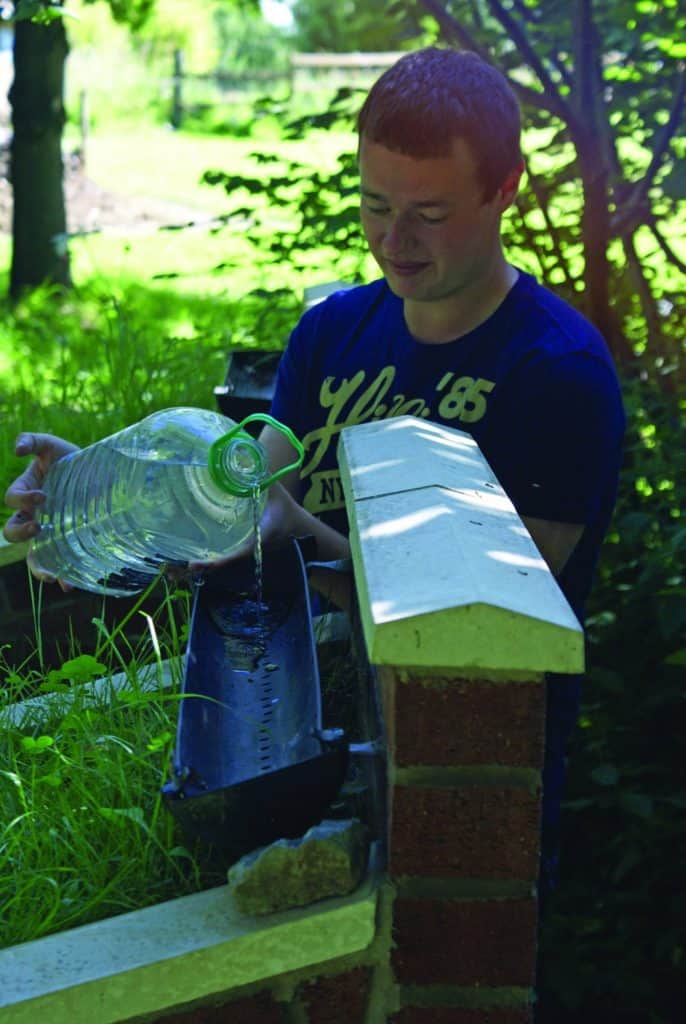
The other person uses the stopwatch first to record the initial response time, i.e. time it takes for the first drop of water to reach the ‘river channel’.
Then record the water level in the measuring cylinder (in millilitres) every 30 seconds for 6 minutes from the start of pouring. Empty the measuring cylinder after every reading, and record a separate figure in millilitres for each 30 second interval. You might need to use two measuring cylinders in rotation if the water is flowing rapidly out of the ‘river channel’ (particularly for the urban ground surface).
Flood management
2. River management score
Carry out a field survey to find out what flood defences are present.
Walk along a short stretch of river. Try to list all the river management techniques being used on both sides of the river. You could also record the length of river frontage that they protect. Stop every 100m and tick which of these techniques are being used
| River management technique | Left | Right |
|---|---|---|
| Bank strengthening | ||
| Planking | ||
| Piling | ||
| Levees | ||
| Gabions | ||
| Concrete wall | ||
| Canalisation | ||
| Organic matting | ||
| Rock armour | ||
| Engineered slope |
Add up the ticks for each site. The total number of ticks gives you a River Management Score.
3. Bi-polar analysis
This helps to assess how successful the flood defences are. Carry out the bi-polar analysis at a number of sites.
A number of criteria are chosen which are scored from the extremely positive (+3) to the extremely negative (-3) see the table below. A pilot survey in two or three locations will help to show whether your criteria are appropriate for the location that you are investigating.
Find the total of all the scores and compare results for each location visited.
| Negative factors | -3 | -2 | -1 | 1 | 2 | 3 | Positive factors |
|---|---|---|---|---|---|---|---|
| Vulnerable to overtopping | Effective against overtopping | ||||||
| Ugly | Enhances natural environment | ||||||
| Prevents public access to river | No limit on public access to river | ||||||
| Disturbs processes of erosion and deposition | No disturbance to processes | ||||||
| High maintenance / operational costs | Low maintenance / operational costs |
4. Questionnaires
Questionnaires are useful for finding out more about people’s
- characteristics (e.g age, sex, place of residence)
- behaviour (e.g. usage of the coast)
- attitudes (e.g. do they agree with a scheme for managed retreat?)
An effective questionnaire contains a mixture of closed and open questions:
Closed questions: answers are limited to single words, numbers of listed options
e.g. “Do you feel safe in Church Street at 8pm?
Possible answers YES or NO
Closed questions can also be given as a statement. Responses are limited to positions on a scale. There are two ways of presenting statements:
(i) Semantic differential scale – use pairs of words and a scale from negative to positive.
e.g. What do you think of the village of Horton-in-Ribblesdale?
Ugly -2 -1 0 +1 +2 Beautiful
Boring -2 -1 0 +1 +2 Lots to do
Dead -2 -1 0 +1 +2 Vibrant
(ii) Likert scale – ask participants whether they agree or disagree with a series of statements. Use statements with a balance of positive and negative.
e.g. “I do not feel in danger walking around Stokesley in the evening.
Answers: Strongly agree / Agree / Don’t know / Disagree / Strongly disagree
(iii) Rating – ask participants to rank a small number of categories from most important to least important.
e.g. What was your main reason your chose to live in this neighbourhood? Please rank the following statements from 1 (most important) to 6 (least important)
Answers: proximity to work, proximity to family and friends, proximity to schools, housing costs, pleasant environment, good place to raise children
Open questions: responses may be long and detailed. Often it is a good idea to word the question so that people could respond with positive answers, negative answers or a mixture of the two. Asking participants to focus on a specific area or time frame may be more effective than just asking “Any other comments?” or “What do you think about this town?” at the end of a questionnaire.
e.g. “Do you think this town will get better or worse in the next 20 years? Why?”
5. Interviews
A properly conducted interview is more than just having a chat with someone. It needs to be carefully planned. You should take detailed notes or, even better, with the particpants’ permission make an audio or video recording so that you can type up a transcript of the event.
(a) Interview strategies
Interviews can be structured, semi-structured or unstructured. In a structured interview, each participant is asked the same questions in the same order. In an unstructured interview, you set a focus for the interview with perhaps one or two introductory questions to break the ice, but allow the discussion to develop naturally. A semi-structured interview is a combination of the two approaches, with some pre-prepared questions but with time for discussion.
If you are using the structured or semi-structured route, prepare a typed list of questions beforehand. 6-8 questions is a realistic aim for a 30 minute interview. If you are using the unstructured route, prepare a list of general issues that you would like to cover in the interview. This will help you steer the discussion so that it covers all the issues, as otherwise conversations may drift.
(b) Choosing people to interview
Interviews can also be carried out individually or in groups. They can be carried out face-to-face, over the telephone or online (e.g. by Skype). Focus groups are a type of unstructured or semi-structured interview in which a group of people discuss topics defined by a researcher.
It is impractical to select a representative sample of people to interview. Instead use non-probability sampling, in which the sample is selected through the subjective judgment of the reseacher. There are three techniques:
Convenience sampling: select people who are easy to reach, e.g. interview existing contacts, such as friends and neighbours.
Snowball sampling: select at least two people. Ask each person to help you find more interviewees. Continue finding new people until you have achieved your desired sample size.
Quota sampling: deliberately select a proportionate number of people from each part of the population.
(c) Choosing questions to ask
There are two issues to consider here: what types of questions that you want to ask, and the order in which you want to ask them.
Consider the following types of question:
(i) Descriptive: questions which ask for facts about people, places and experiences, e.g. “How long have you lived in this town?”
(ii) Storytelling: questions that ask participants to put events in order, e.g. “Can you tell me how this town has changed since you first moved here?”
(iii) Opinion: questions that ask about perceptions and feelings, e.g. “Is there enough for teenagers to do in this town in the evening?”
(iv) Stuctural: questions that ask people to reflect on why they hold particular opinions, e.g. “How do you think you came to hold that opinion?”
(v) Contrast: questions that ask people to put themselves in someone else’s shoes, e.g “Would you think differently about how safe the town centre if you were male/female/elderly/young?”
Often the hardest part of the interview is the start. Careful ordering of questions will help you build up rapport with the participants and maintain momentum over the course of the whole interview. Think of the interview are structured like a pyramid, with the easy-to-answer descriptive questions near the start and the most abstract questions (like structural and contrast questions) near the end. Ensure a polite finish (e.g. “Thanks for your time. You’ve given me some really useful information from this interview”).
Some interviewees will be more chatty than others. Nudge less chatty interviewees with prompt questions (e.g. “What do you mean by that?” when an answer is unclear or incomplete). Eye contact, smiling and nodding will let the interviewee know that you are interested in what they have to say, and will encourage them to say more – don’t yawn at them!
6. Oral histories
Oral history is the recording of people’s memories, experiences and opinions. Older residents of a place which experiences flooding may be a valuable source of information. Oral history can be thought of as unstructured interview, in which you allow the participant to speak at length, perhaps prompted with open questions. If you are interested in carrying out an oral history interview, see the practical advice available at the British Oral History Society website (http://www.ohs.org.uk/advice/getting-started/).
Risk and vulnerability
7. Risk mapping
Flood risk can be quantified by using the equation: Risk = Likelihood × Severity
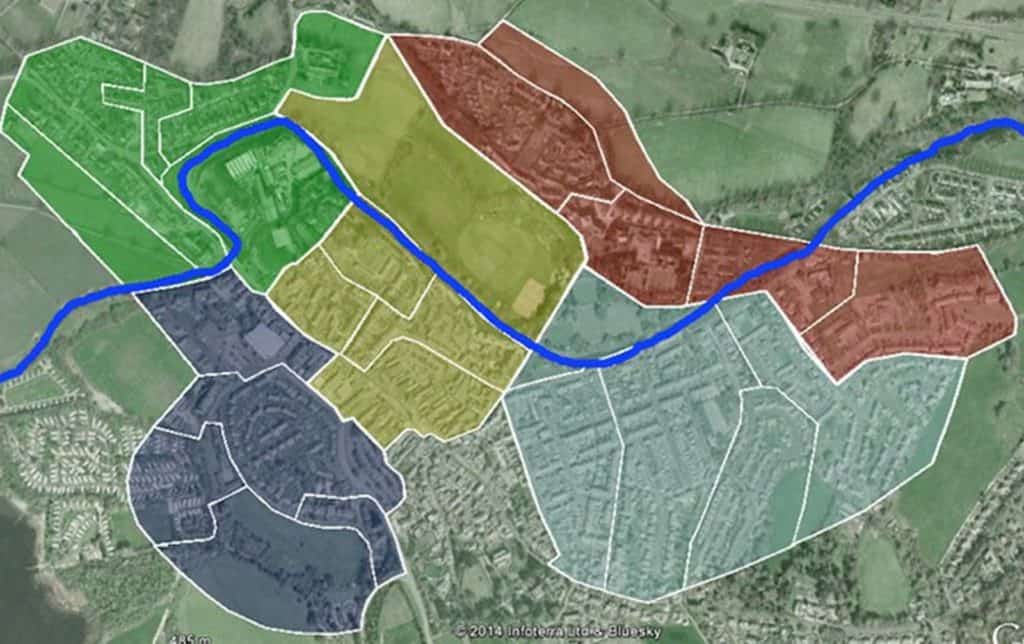
Step 1. Choose a suitable site
Select a study area which experiences flooding issues. Divide the study area. This could be done placing a grid over a map of the area. Or simple zones can be made based on locality, post code or height above the river.
Step 2. Measure flood likelihood
The likelihood that any particular site will be flooded by a river depends on many factors. The two most straightforward factors to measure in the field are
- Height of land above river level. This data can be obtained from a map, Google Earth or you can use GPS altitude readings taken in each zone. Put the raw data into categories (as in the table). The exact height categories that you choose will be specific to the site.
| Score | Height (m) |
|---|---|
| 5 | 0 – 5 |
| 4 | 5- 10 |
| 3 | 10-15 |
| 2 | 15 – 20 |
| 1 | 20 -25 |
- Distance from river. Measure the shortest distance between the centre of the zone and the edge of the river. This can be done by using a map, Google Earth or a trundle wheel. Put the raw data into categories (as in the table). The exact distance categories that you choose will be specific to the site.
| Score | Distance (m) |
| 5 | 0 – 49 |
| 4 | 50 – 99 |
| 3 | 100 – 149 |
| 2 | 150 – 199 |
| 1 | 200+ |
Find the mean of the two likelihood scores. This will give you an index of flood likelihood for each zone of between 1 and 5.
Step 3. Measure flood severity
The same level of flooding will cause more damage in some places (e.g. a hospital) than in others (e.g. a public park). The two most straightforward factors to measure in the field are:
- Percentage of built-up land. Estimate the percentage of built-up land in each survey zone. Put the raw data into categories (as in the table). The exact % built-up land bands that you choose will be specific to the site.
| Score | % built-up land |
|---|---|
| 5 | 80 – 100 |
| 4 | 60 -79 |
| 3 | 40 -59 |
| 2 | 20 -39 |
| 1 | 0 – 19 |
- Land use (potential economic loss). Record the dominant land use for each survey square. Put the raw data into categories (as in the table). The land use categories that you choose will be specific to the site.
| Score | Description of land use |
|---|---|
| 5 | High-status retail (e.g. department stores); High-tech industry; Offices. |
| 4 | High value housing; Low-order retail. Possibly small-scale industry / cafes / pubs. |
| 3 | Middle value housing; Community services; Small independent retail stores. |
| 2 | Low value housing; Small convenience stores; Small independent garages; Storage facilities / warehouses. |
| 1 | Open space (e.g. car parks, derelict land, parks, allotments). |
Find the mean of the two severity scores. This will give you an index of flood severity for each zone of between 1 and 5.
Step 4. Calculate flood risk
Risk = Likelihood × Severity Multiply your mean likelihood and mean severity scores together to give a flood risk score for each zone.
Secondary data sources
1. Weather data
It is useful to obtain weather data for the weeks before your fieldwork. The Met Office archive is an excellent place to start. It provides monthly summaries back to 1998, with links to older station data as well.
2. Drainage basin characteristics
The first place to start is the Catchment Data Explorer For more information about the rocks and other sediments in the drainage basin, the British Geological Survey’s map viewer is a superb geographical information system.
3. Historical river levels
For more information about monthly and annual river flow, the National River Flow Archive is useful.
4. Flood management
To find out more about flood risk, the Environment Agency’s flood map is a geographical information system. You can search the map by postcode. The Environment Agency or your local council may also have published online sources detailing local flood defence schemes.
5. People’s experience of flooding
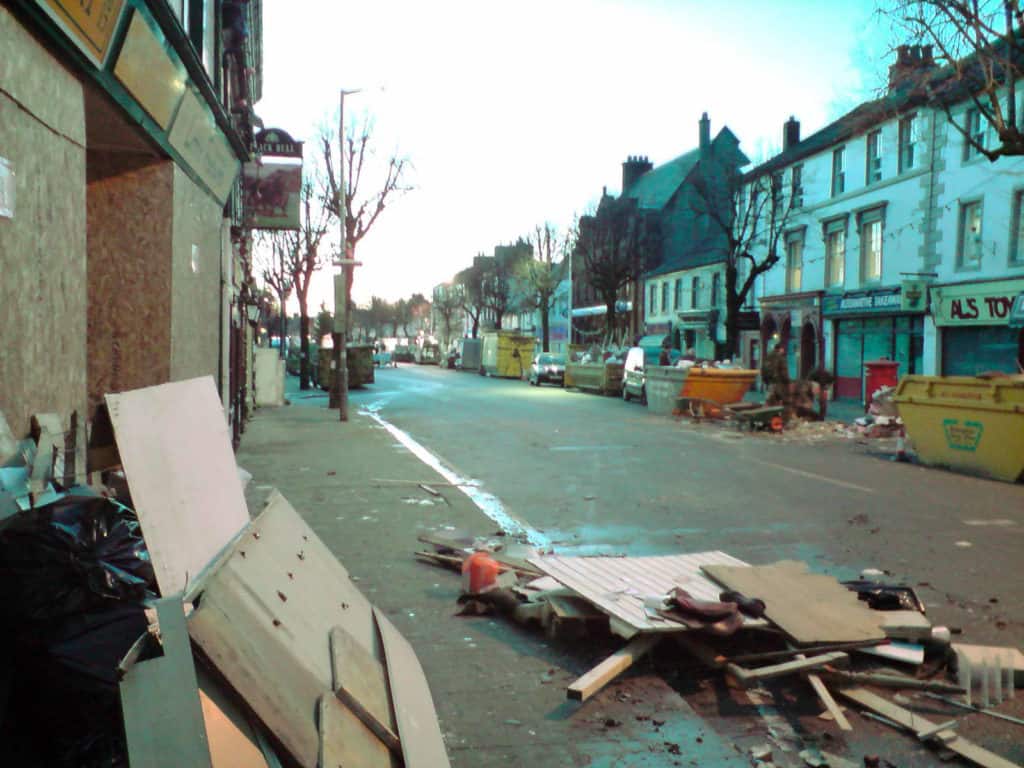
To find people’s accounts or news reports on recent flooding search for videos on You Tube or other social media. Historical photos or videos can provide a useful comparison to photos taken in the field, but you should consider the reliability of your sources.

Secondary and Further Education Courses
Set your students up for success with our secondary school trips and courses. Offering excellent first hand experiences for your students, all linked to the curriculum.
Group Leader and Teacher Training
Centre-based and digital courses for teachers